![Distressed Properties Postscript: Looking at Cumulative Days on Market]()
by RMLS Communication Department | Apr 22, 2015
 Click to enlarge
Ever wonder how distressed properties fare in terms of their cumulative days on market (CDOM) versus traditional listings?
RMLS™ tax data guru Kim Hutchinson has been tracking CDOM on RMLSweb since July 2009 and as a follow-up to last week’s release of the Q1 2015 residential distressed properties infographics, we put his collected monthly records into graph form.
Enjoy!
by RMLS Communication Department | Apr 20, 2015
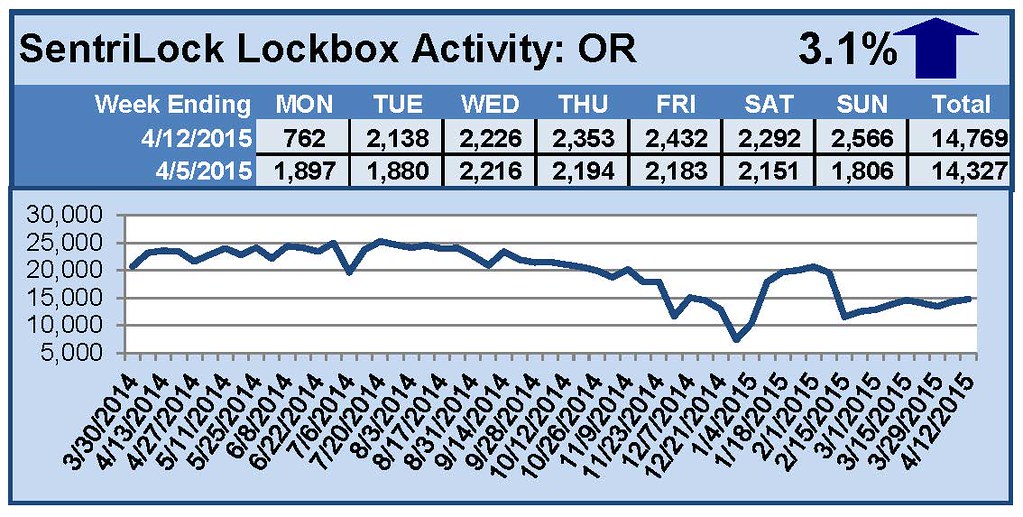
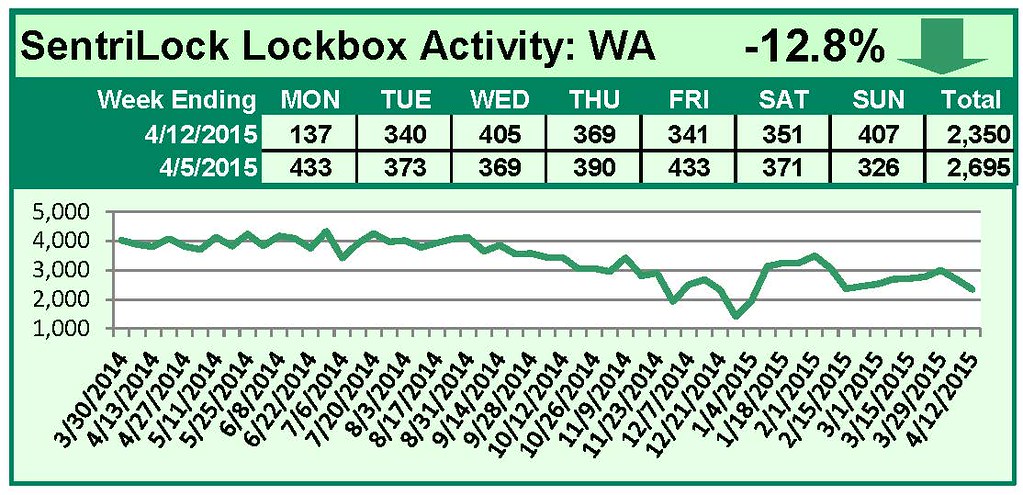
This Week’s Lockbox Activity
For the week of April 6-12, 2015, these charts show the number of times RMLS™ subscribers opened SentriLock lockboxes in Oregon and Washington. Washington saw a decrease in activity this week, while Oregon saw activity increase.
For a larger version of each chart, visit the RMLS™ photostream on Flickr.
![Distressed Properties Postscript: Looking at Cumulative Days on Market]()
by RMLS Communication Department | Apr 16, 2015

This chart shows the number of bank owned/REO properties and short sales in all areas of the RMLS™ system during the first quarter of 2015.
Below are links to additional charts for some of our larger areas.
• Portland Metro Area Distressed Properties (1st Quarter 2015)
• Clark County, WA Distressed Properties (1st Quarter 2015)
• Lane County, OR Distressed Properties (1st Quarter 2015)
• Douglas County, OR Distressed Properties (1st Quarter 2015)
• Coos County, OR Distressed Properties (1st Quarter 2015)
Here are some additional facts about distressed residential properties in the first quarter of 2015:
All areas when comparing percentage share of the market, first quarter 2015 to fourth quarter 2014:
• When comparing the first quarter 2015 to fourth quarter 2014, distressed sales as a percentage of new listings decreased by 3.1% (8.9 v. 12.0%).
• In a comparison of the first quarter 2015 to fourth quarter 2014, distressed sales as a percentage of closed sales increased by 2.8% (12.3 v. 9.5%).
• Short sales comprised 2.9% of new listings and 3.4% of sales in the first quarter of 2015, down 0.6% and up 0.4% from the fourth quarter of 2014, respectively.
• Bank owned/REO properties comprised 6.0% of new listings and 8.9% of sales in the first quarter of 2015, down 2.5% and up 2.4% from the fourth quarter of 2014, respectively.
Portland metro when comparing percentage share of the market, first quarter 2015 to fourth quarter 2014:
• When comparing the first quarter 2015 to fourth quarter 2014, distressed sales as a percentage of new listings decreased by 3.0% (7.7 v. 10.7%).
• In a comparison of first quarter 2015 to fourth quarter 2014, distressed sales as a percentage of closed sales increased by 1.9% (10.1 v. 8.2%).
• Short sales comprised 2.8% of new listings and 3.0% of sales in the first quarter of 2015, down 1.0% and up 0.1% from the fourth quarter of 2014, respectively.
• Bank owned/REO properties comprised 4.9% of new listings and 7.1% of sales in the first quarter of 2015, down 2.0% and up 1.8% from the fourth quarter of 2014, respectively.
Clark County when comparing percentage share of the market, first quarter 2015 to fourth quarter 2014:
• When comparing the first quarter 2015 to fourth quarter 2014, distressed sales as a percentage of new listings decreased by 3.4% (9.3 v. 12.7%).
• In a comparison of first quarter 2015 to fourth quarter 2014, distressed sales as a percentage of closed sales increased by 2.5% (14.0 v. 11.5%).
• Short sales comprised 4.4% of new listings and 5.0% of sales in the first quarter of 2015, staying even for new listings and up 0.7% for sales when compared to the fourth quarter of 2014, respectively.
• Bank owned/REO properties comprised 4.9% of new listings and 9.0% of sales in the first quarter of 2015, down 3.4% and up 1.8% from the fourth quarter of 2014, respectively.
If you’d like more information or percentages of distressed residential sales in other areas not represented by our charts, please contact us at communications@rmls.com.
by RMLS Communication Department | Apr 13, 2015
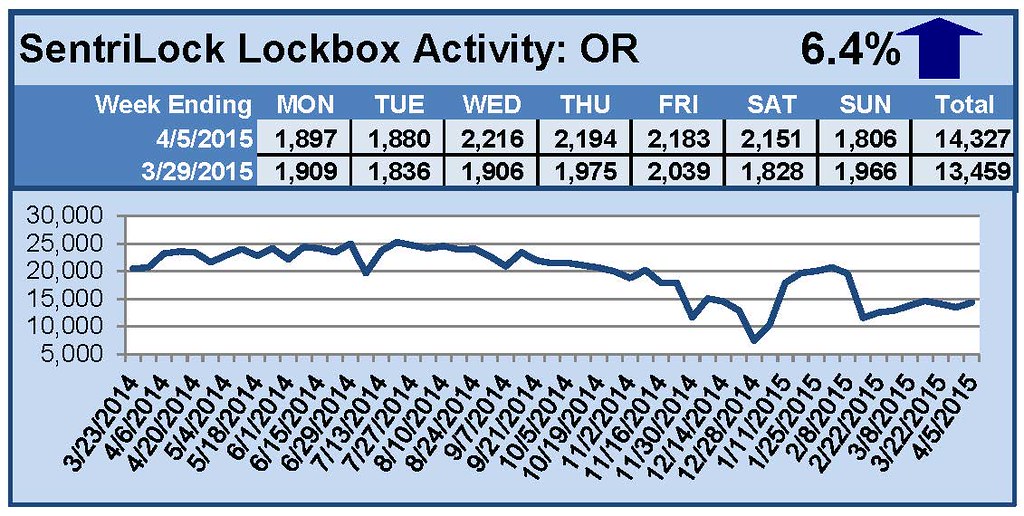
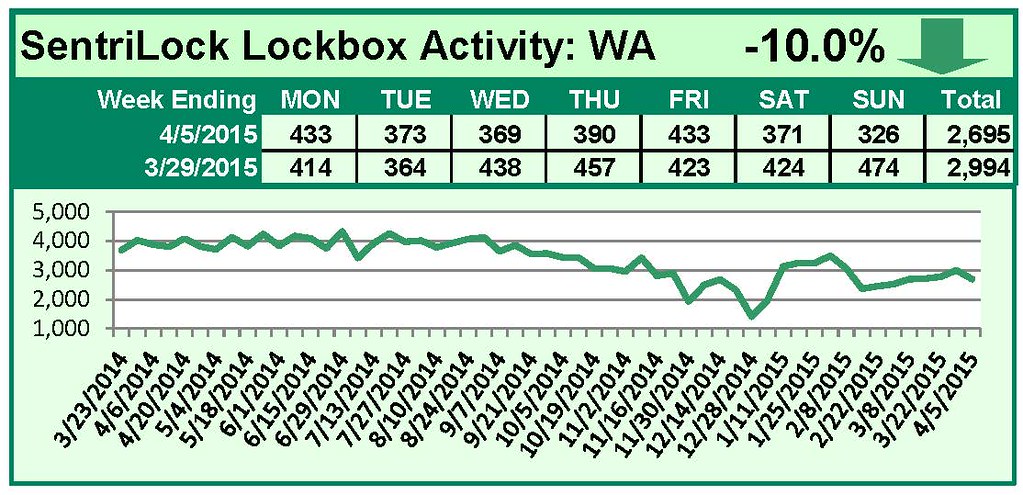
This Week’s Lockbox Activity
For the week of March 30-April 5, 2015, these charts show the number of times RMLS™ subscribers opened SentriLock lockboxes in Oregon and Washington. Activity in Oregon increased this week, while activity in Washington decreased.
For a larger version of each chart, visit the RMLS™ photostream on Flickr.
by RMLS Communication Department | Apr 6, 2015

This Week’s Lockbox Activity
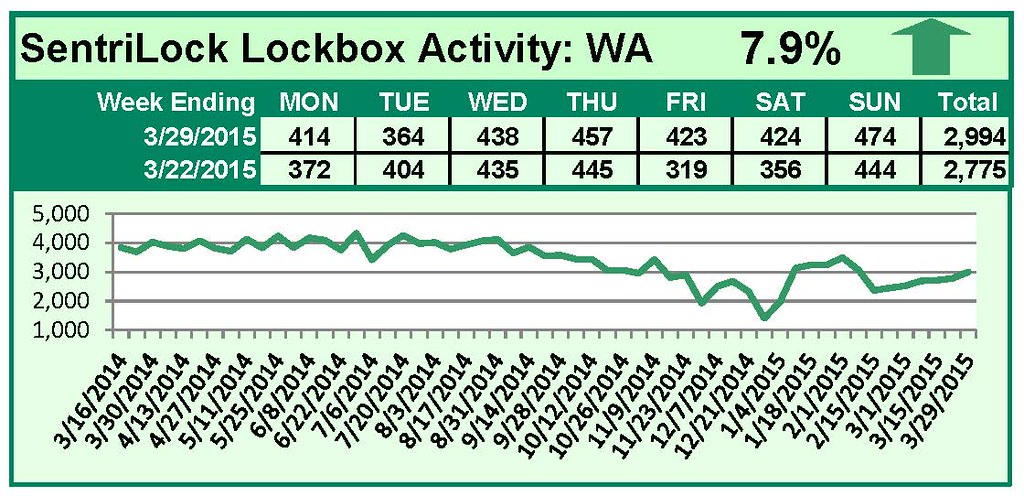
For the week of March 23-29, 2015, these charts show the number of times RMLS™ subscribers opened SentriLock lockboxes in Oregon and Washington. Washington saw an increase in lockbox activity this week, while numbers decreased in Oregon.
For a larger version of each chart, visit the RMLS™ photostream on Flickr.
by RMLS Communication Department | Mar 30, 2015
This Week’s Lockbox Activity
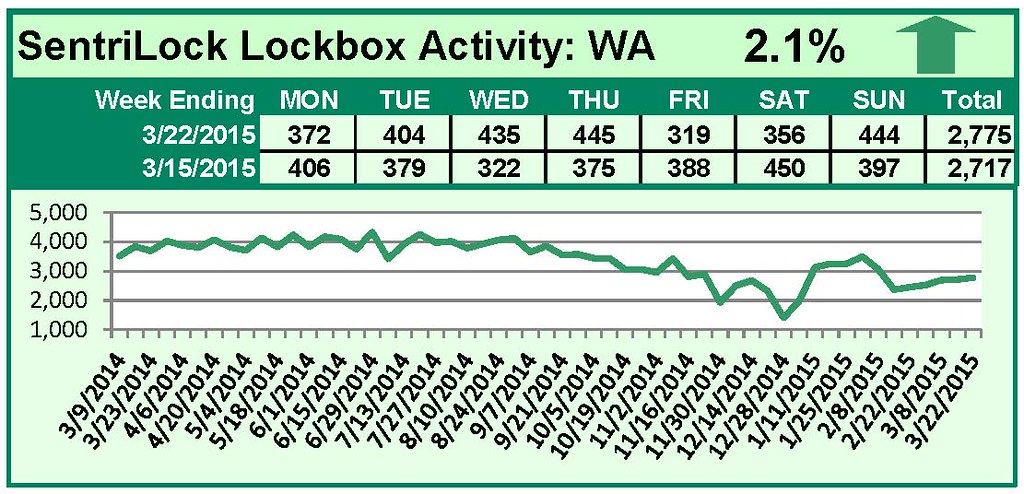
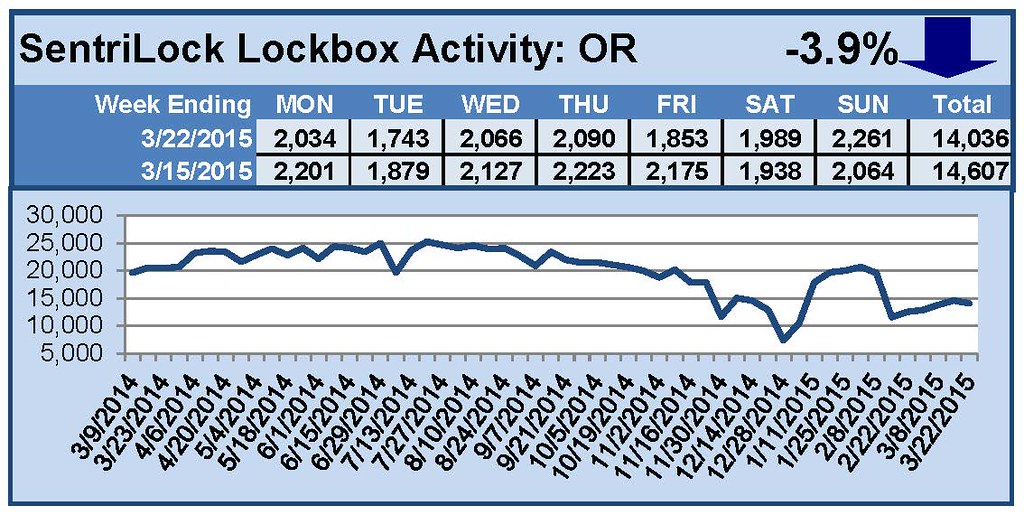
For the week of March 16-22, 2015, these charts show the number of times RMLS™ subscribers opened SentriLock lockboxes in Oregon and Washington. Lockbox activity increased in Washington, but decreased in Oregon this week.
For a larger version of each chart, visit the RMLS™ photostream on Flickr.
 Click to enlarge