by RMLS Communication Department | Jul 21, 2014
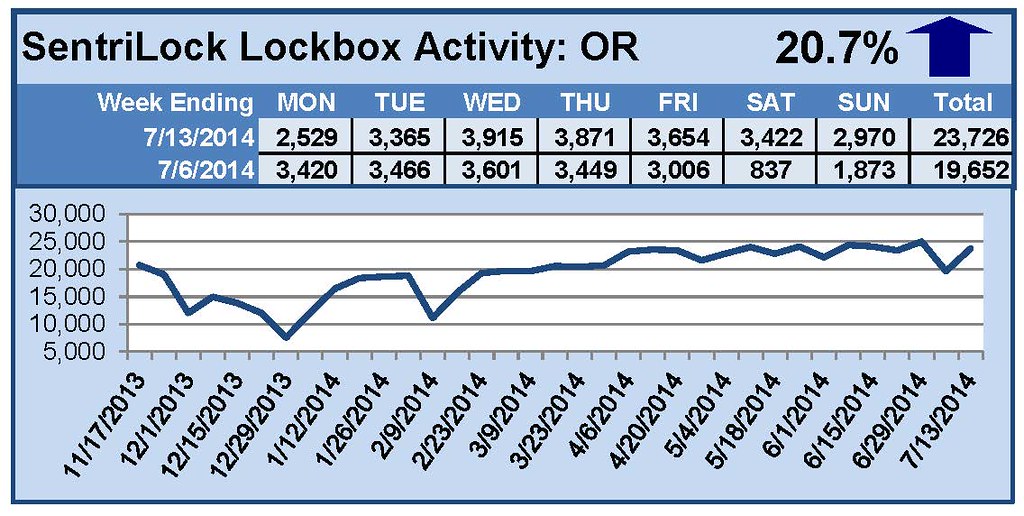
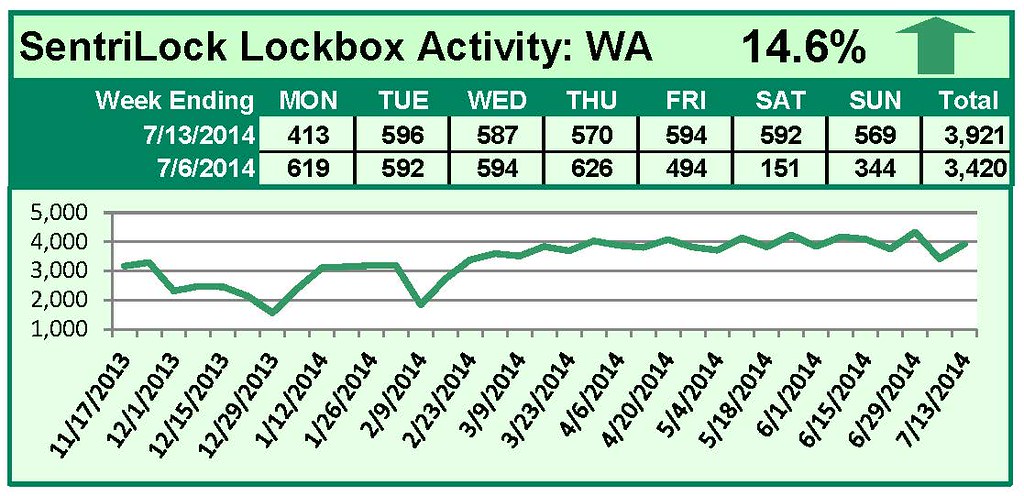
This Week’s Lockbox Activity
For the week of July 7-13, 2014, these charts show the number of times RMLS™ subscribers opened SentriLock lockboxes in Oregon and Washington. Activity rebounded in both Oregon and Washington this week.
For a larger version of each chart, visit the RMLS™ photostream on Flickr.
Please note: due to the RMLS™ transition to SentriLock, historical data is only currently available through the RMLS™ Flickr page, under the tag “Supra lockbox activity.” SentriLock data will continue accumulating until each chart represents a year of data.
![Residential Distressed Properties for Second Quarter (April-June) 2014]()
by RMLS Communication Department | Jul 16, 2014
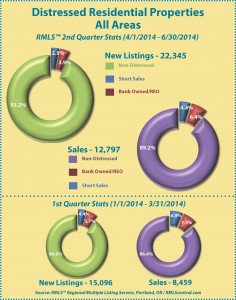
This chart shows the number of bank owned/REO properties and short sales in all areas of the RMLS™ system during the second quarter of 2014.
Below are links to additional charts for some of our larger areas.
• Portland Metro Distressed Properties (2nd Quarter 2014)
• Clark County, WA Distressed Properties (2nd Quarter 2014)
• Lane County, OR Distressed Properties (2nd Quarter 2014)
• Douglas County, OR Distressed Properties (2nd Quarter 2014)
• Coos County, OR Distressed Properties (2nd Quarter 2014)
Here are some additional facts about distressed residential properties in the second quarter of 2014:
All areas when comparing percentage share of the market, second quarter 2014 to first quarter 2014:
• When comparing the second quarter 2014 to first quarter 2014, distressed sales as a percentage of new listings decreased by 3.3% (6.8 v. 10.1%).
• In a comparison of the second quarter 2014 to first quarter 2014, distressed sales as a percentage of closed sales decreased by 2.8% (10.8 v. 13.6%).
• Short sales comprised 2.9% of new listings and 4.4% of sales in the second quarter of 2014, down 1.5% and 1.9% from the first quarter of 2014, respectively.
• Bank owned/REO properties comprised 3.9% of new listings and 6.4% of sales in the second quarter of 2014, down 1.8% and 0.9% from the first quarter of 2014, respectively.
Portland metro when comparing percentage share of the market, second quarter 2014 to first quarter 2014:
• When comparing the second quarter 2014 to first quarter 2014, distressed sales as a percentage of new listings decreased by 2.8% (6.1 v. 8.9%).
• In a comparison of second quarter 2014 to first quarter 2014, distressed sales as a percentage of closed sales decreased by 2.2% (8.8 v. 11.0%).
• Short sales comprised 3.0% of new listings and 4.1% of sales in the second quarter of 2014, down 1.3% and 2.0% from the first quarter of 2014, respectively.
• Bank owned/REO properties comprised 3.1% of new listings and 4.7% of sales in the second quarter of 2014, down 1.5% and 0.2% from the first quarter of 2014, respectively.
Clark County when comparing percentage share of the market, second quarter 2014 to first quarter 2014:
• When comparing the second quarter 2014 to first quarter 2014, distressed sales as a percentage of new listings decreased by 3.1% (9.4 v. 12.5%).
• In a comparison of second quarter 2014 to first quarter 2014, distressed sales as a percentage of closed sales decreased by 7.3% (15.8 v. 23.1%).
• Short sales comprised 4.7% of new listings and 6.7% of sales in the second quarter of 2014, down 1.2% for new listings and 4.2% for sales when compared to the first quarter of 2014, respectively.
• Bank owned/REO properties comprised 4.7% of new listings and 9.1% of sales in the second quarter of 2014, down 1.9% and 3.1% from the first quarter of 2014, respectively.
If you’d like more information or percentages of distressed residential sales in other areas not represented by our charts, please contact us at communications@rmls.com.
by RMLS Communication Department | Jul 14, 2014
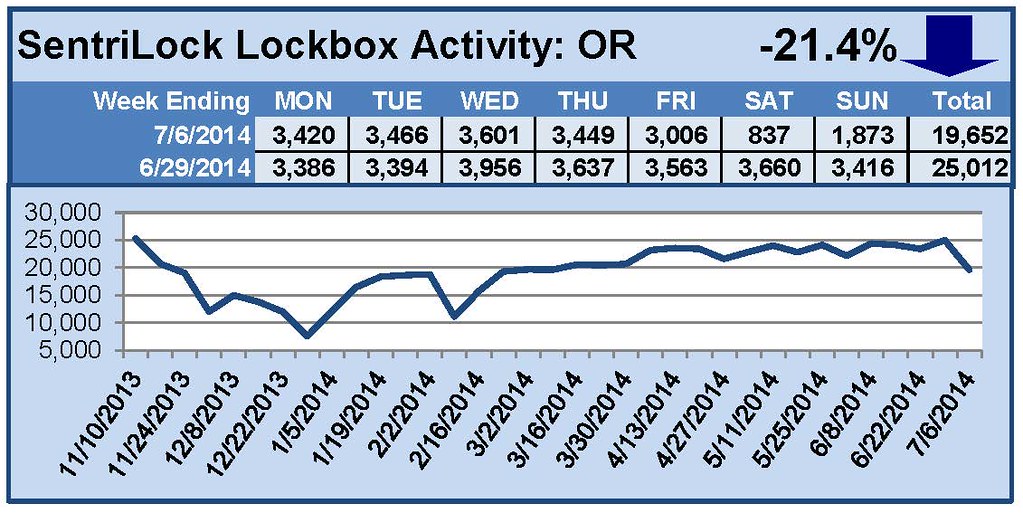
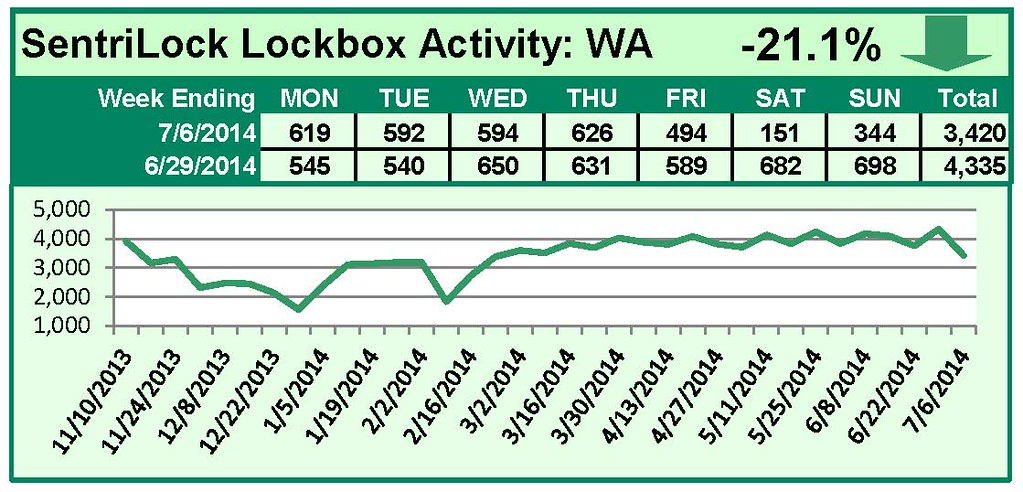
This Week’s Lockbox Activity
For the week of June 30-July 6, 2014, these charts show the number of times RMLS™ subscribers opened SentriLock lockboxes in Oregon and Washington. The number of showings fell sharply in both Oregon and Washington this week.
For a larger version of each chart, visit the RMLS™ photostream on Flickr.
Please note: due to the RMLS™ transition to SentriLock, historical data is only currently available through the RMLS™ Flickr page, under the tag “Supra lockbox activity.” SentriLock data will continue accumulating until each chart represents a year of data.
by RMLS Communication Department | Jul 7, 2014
This Week’s Lockbox Activity
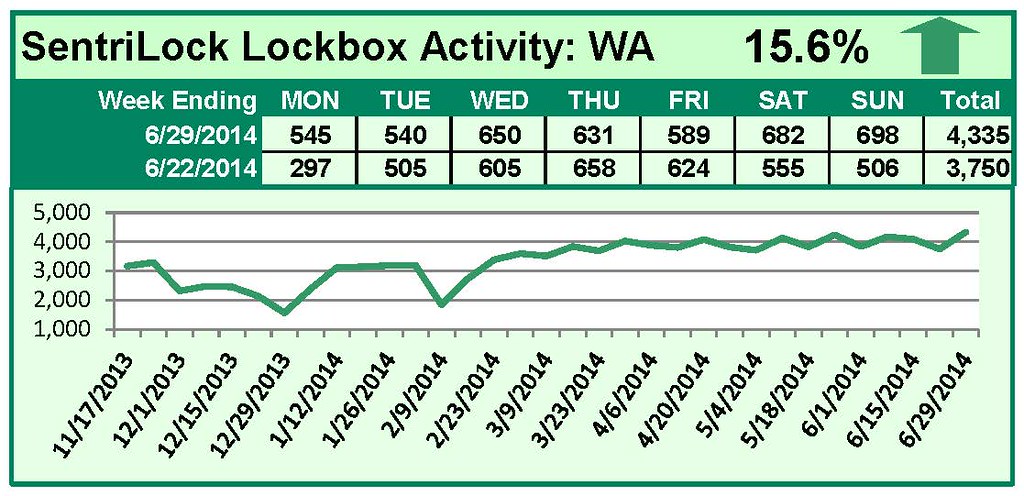
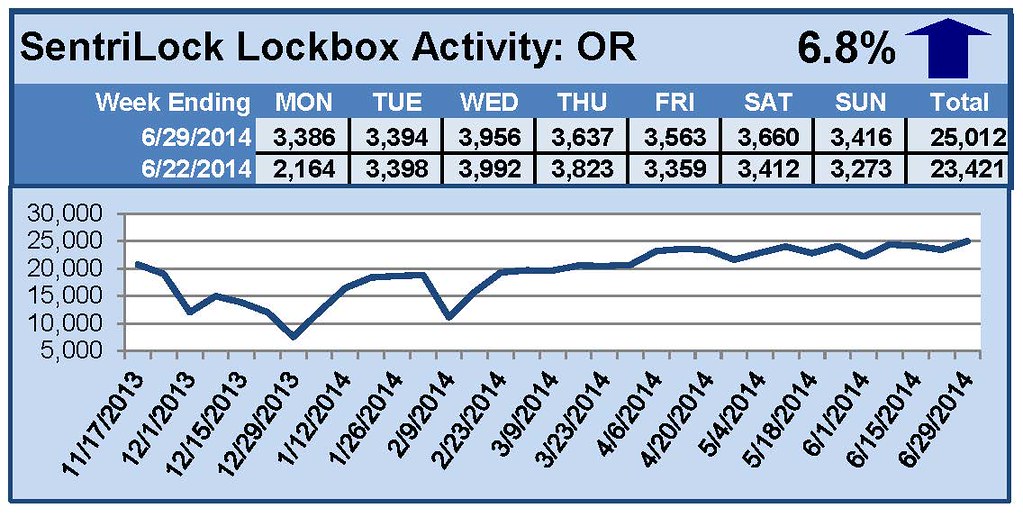
For the week of June 23-29, 2014, these charts show the number of times RMLS™ subscribers opened SentriLock lockboxes in Oregon and Washington. Showing activity rose in both Oregon and Washington this week.
For a larger version of each chart, visit the RMLS™ photostream on Flickr.
Please note: due to the RMLS™ transition to SentriLock, historical data is only currently available through the RMLS™ Flickr page, under the tag “Supra lockbox activity.” SentriLock data will continue accumulating until each chart represents a year of data.
by RMLS Communication Department | Jun 30, 2014
This Week’s Lockbox Activity
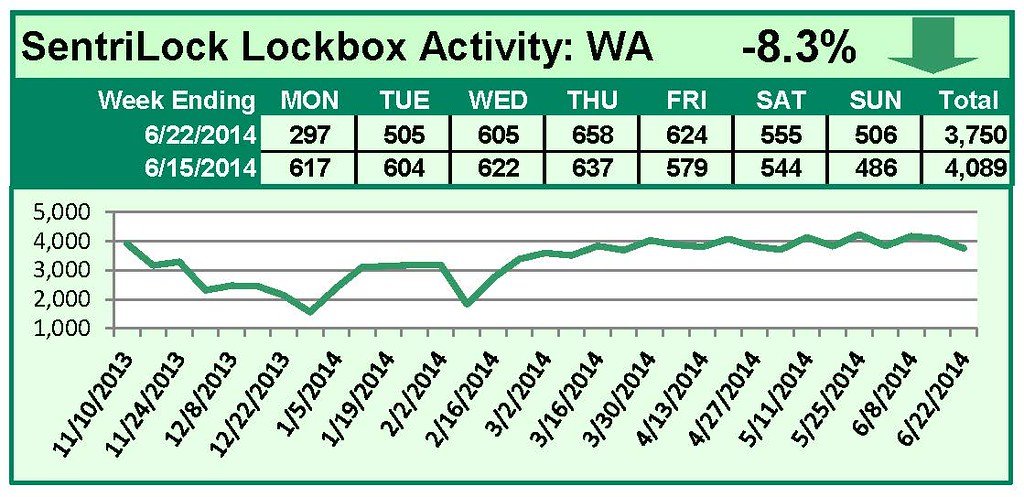
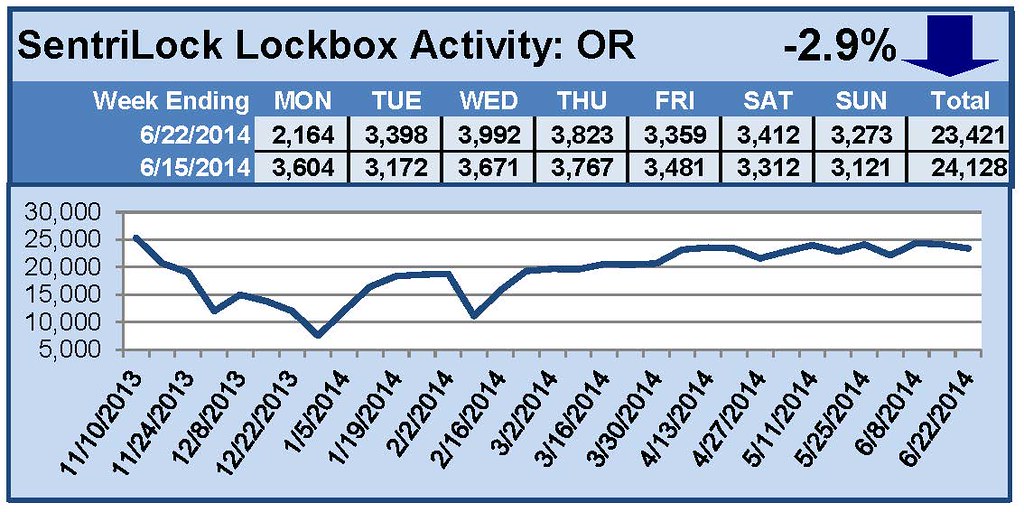
For the week of June 16-22, 2014, these charts show the number of times RMLS™ subscribers opened SentriLock lockboxes in Oregon and Washington. Activity fell in both Oregon and Washington again this week.
For a larger version of each chart, visit the RMLS™ photostream on Flickr.
Please note: due to the RMLS™ transition to SentriLock, historical data is only currently available through the RMLS™ Flickr page, under the tag “Supra lockbox activity.” SentriLock data will continue accumulating until each chart represents a year of data.
by RMLS Communication Department | Jun 23, 2014
This Week’s Lockbox Activity
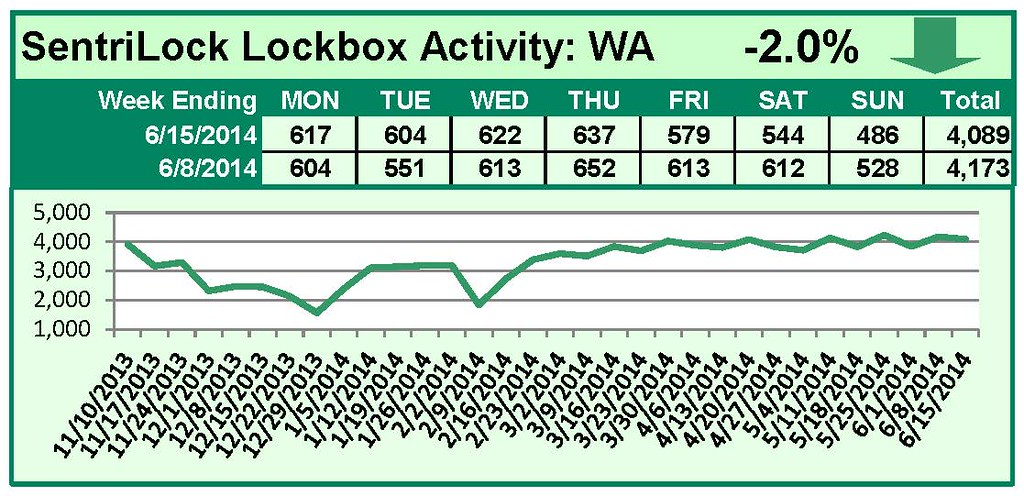
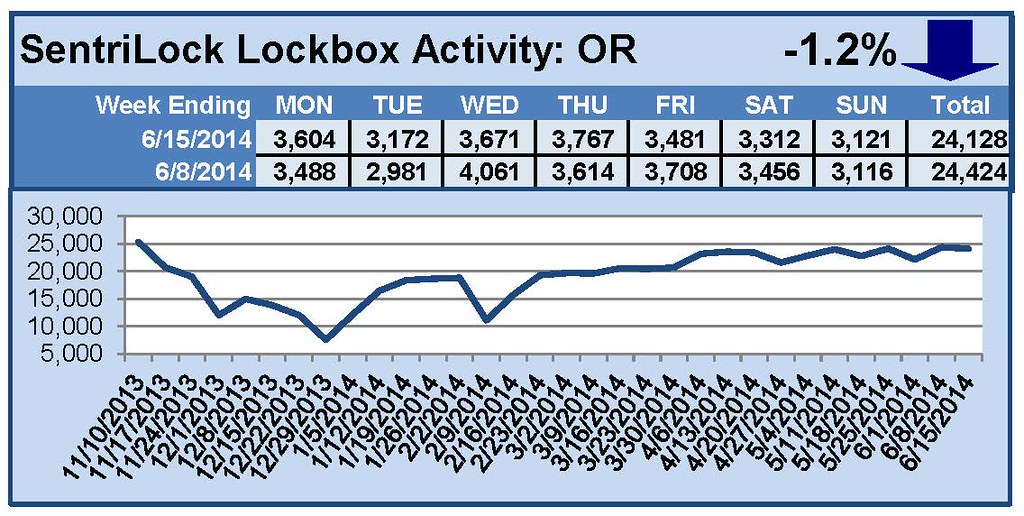
For the week of June 9-15, 2014, these charts show the number of times RMLS™ subscribers opened SentriLock lockboxes in Oregon and Washington. Activity fell in both Oregon and Washington this week.
For a larger version of each chart, visit the RMLS™ photostream on Flickr.
Please note: due to the RMLS™ transition to SentriLock, historical data is only currently available through the RMLS™ Flickr page, under the tag “Supra lockbox activity.” SentriLock data will continue accumulating until each chart represents a year of data.