by RMLS Communication Department | May 5, 2014
This Week’s Lockbox Activity
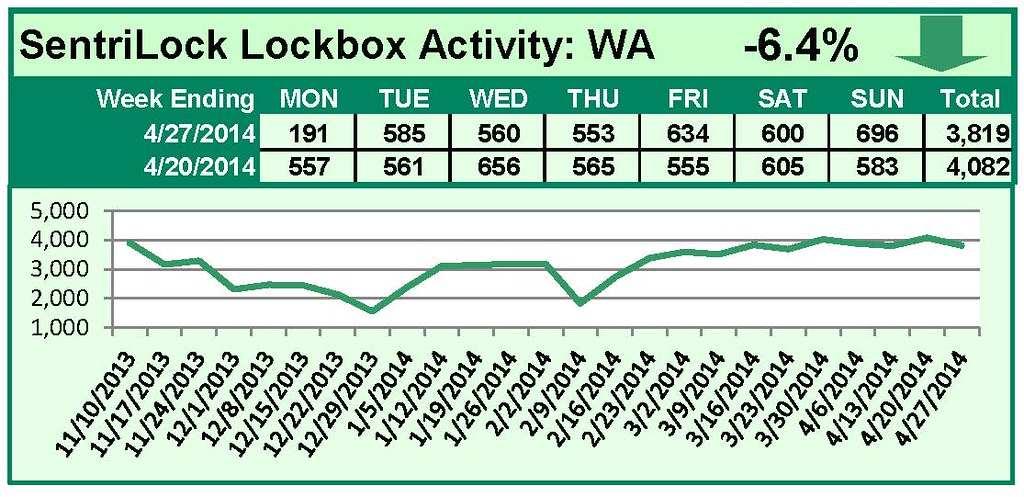
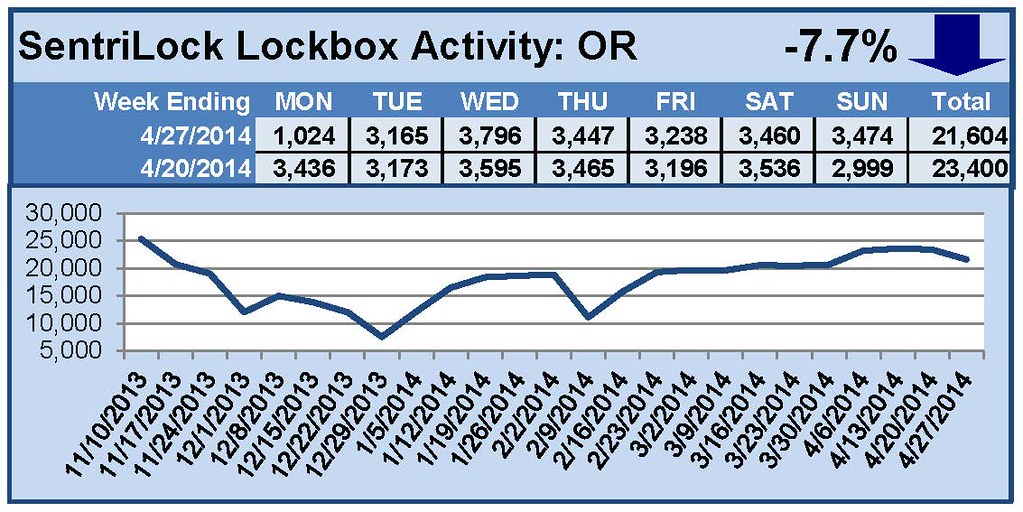
For the week of April 21-27, 2014, these charts show the number of times RMLS™ subscribers opened SentriLock lockboxes in Oregon and Washington. Activity decreased in both states this week.
For a larger version of each chart, visit the RMLS™ photostream on Flickr.
Please note: due to the RMLS™ transition to SentriLock, historical data is only currently available through the RMLS™ Flickr page, under the tag “Supra lockbox activity.” SentriLock data will continue accumulating until each chart represents a year of data.
by RMLS Communication Department | Apr 28, 2014

This Week’s Lockbox Activity
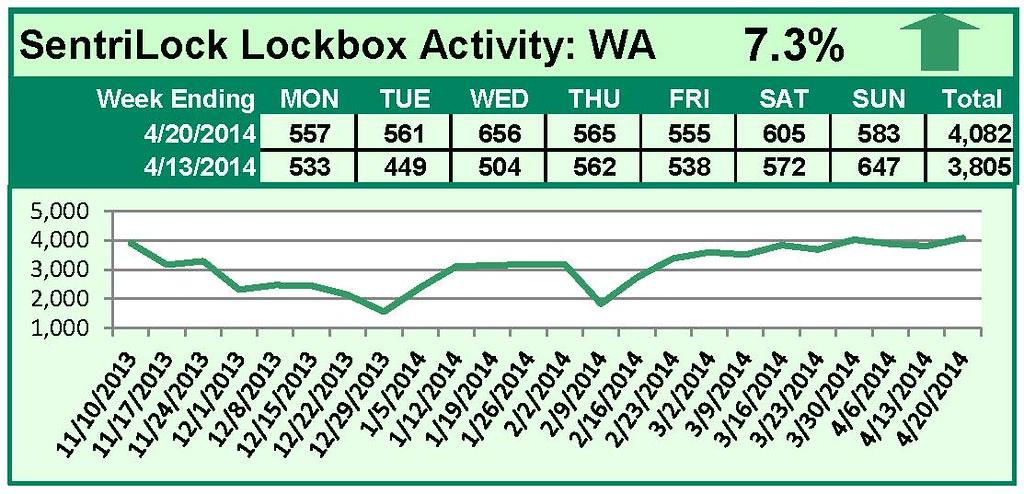
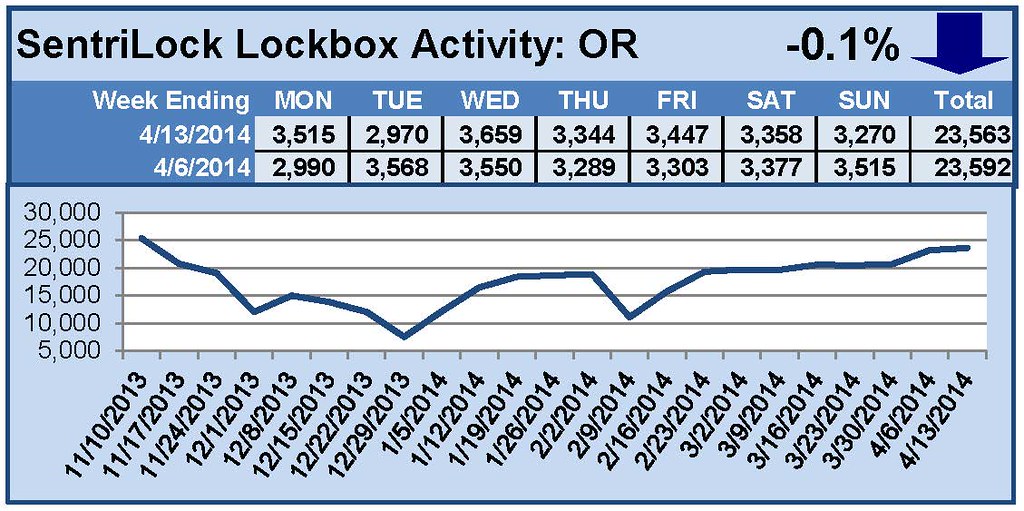
For the week of April 14-20, 2014, these charts show the number of times RMLS™ subscribers opened SentriLock lockboxes in Oregon and Washington. There was an increase in activity in Washington, while Oregon saw a slight decrease this week.
For a larger version of each chart, visit the RMLS™ photostream on Flickr.
Please note: due to the RMLS™ transition to SentriLock, historical data is only currently available through the RMLS™ Flickr page, under the tag “Supra lockbox activity.” SentriLock data will continue accumulating until each chart represents a year of data.
by RMLS Communication Department | Apr 21, 2014
This Week’s Lockbox Activity
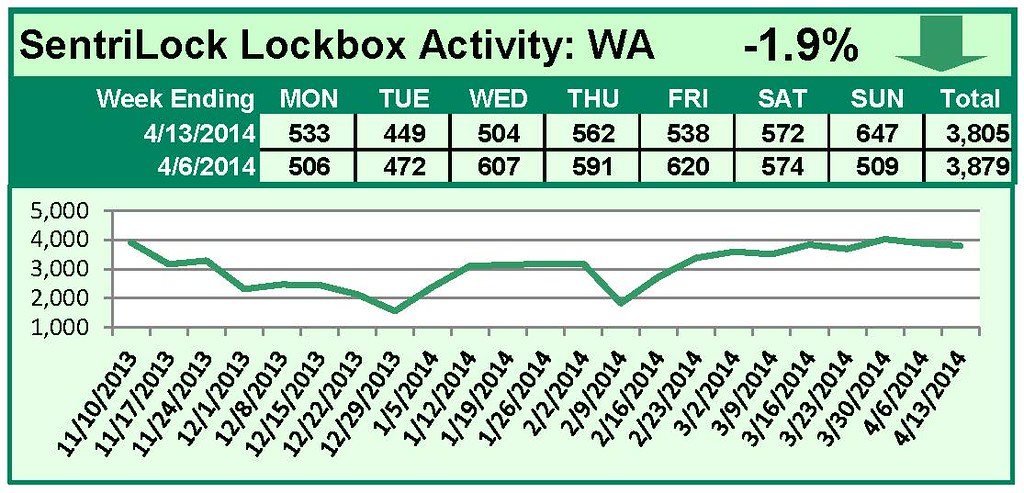
For the week of April 7-13, 2014, these charts show the number of times RMLS™ subscribers opened SentriLock lockboxes in Oregon and Washington. Activity fell in both Oregon and Washington this week.
For a larger version of each chart, visit the RMLS™ photostream on Flickr.
Please note: due to the RMLS™ transition to SentriLock, historical data is only currently available through the RMLS™ Flickr page, under the tag “Supra lockbox activity.” SentriLock data will continue accumulating until each chart represents a year of data.
![Residential Distressed Properties for First Quarter (January-March) 2014]()
by RMLS Communication Department | Apr 17, 2014
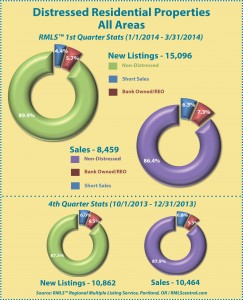
This chart shows the number of bank owned/REO properties and short sales in all areas of the RMLS™ system during the first quarter of 2014.
Below are links to additional charts for some of our larger areas.
• Portland Metro Distressed Properties (1st Quarter 2014)
• Clark County, WA Distressed Properties (1st Quarter 2014)
• Lane County, OR Distressed Properties (1st Quarter 2014)
• Douglas County, OR Distressed Properties (1st Quarter 2014)
• Coos County, OR Distressed Properties (1st Quarter 2014)
Here are some additional facts about distressed residential properties in the first quarter of 2014:
All areas when comparing percentage share of the market, first quarter 2014 to fourth quarter 2013:
• When comparing the first quarter 2014 to fourth quarter 2013, distressed sales as a percentage of new listings decreased by 2.4% (10.1 v. 12.5%).
• In a comparison of the first quarter 2014 to fourth quarter 2013, distressed sales as a percentage of closed sales increased by 1.5% (13.6 v. 12.1%).
• Short sales comprised 4.4% of new listings and 6.3% of sales in the first quarter of 2014, down 1.6% and 0.5% from the fourth quarter of 2013, respectively.
• Bank owned/REO properties comprised 5.7% of new listings and 7.3% of sales in the first quarter of 2014, down 0.8% and up 2.0% from the fourth quarter of 2013, respectively.
Portland metro when comparing percentage share of the market, first quarter 2014 to fourth quarter 2013:
• When comparing the first quarter 2014 to fourth quarter 2013, distressed sales as a percentage of new listings decreased by 1.7% (8.9 v. 10.6%).
• In a comparison of first quarter 2014 to fourth quarter 2013, distressed sales as a percentage of closed sales increased by 0.2% (11.0 v. 10.8%).
• Short sales comprised 4.3% of new listings and 6.1% of sales in the first quarter of 2014, down 1.7% and 1.1% from the fourth quarter of 2013, respectively.
• Bank owned/REO properties comprised 4.6% of new listings and 4.9% of sales in the first quarter of 2014, even with and up 1.3% from the fourth quarter of 2013, respectively.
Clark County when comparing percentage share of the market, first quarter 2014 to fourth quarter 2013:
• When comparing the first quarter 2014 to fourth quarter 2013, distressed sales as a percentage of new listings decreased by 6.1% (12.5 v. 18.6%).
• In a comparison of first quarter 2014 to fourth quarter 2013, distressed sales as a percentage of closed sales increased by 5.5% (23.1 vs. 17.6%).
• Short sales comprised 5.9% of new listings and 10.9% of sales in the first quarter of 2014, up 2.3% for new listings and 1.8% for sales when compared to the fourth quarter of 2013, respectively.
• Bank owned/REO properties comprised 6.6% of new listings and 12.2% of sales in the first quarter of 2014, down 3.8% and up 3.7% from the fourth quarter of 2013, respectively.
If you’d like more information or percentages of distressed residential sales in other areas not represented by our charts, please contact us at communications@rmls.com.
by RMLS Communication Department | Apr 14, 2014

This Week’s Lockbox Activity
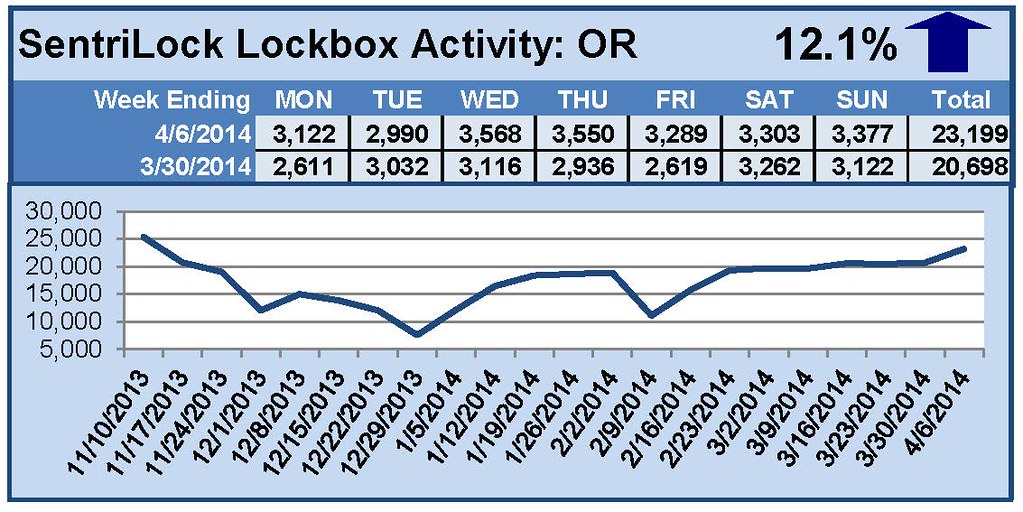
For the week of March 31-April 6, 2014, these charts show the number of times RMLS™ subscribers opened SentriLock lockboxes in Oregon and Washington. Showings rose in Oregon, but fell in Washington this week.
For a larger version of each chart, visit the RMLS™ photostream on Flickr.
Please note: due to the RMLS™ transition to SentriLock, historical data is only currently available through the RMLS™ Flickr page, under the tag “Supra lockbox activity.” SentriLock data will continue accumulating until each chart represents a year of data.
by RMLS Communication Department | Apr 7, 2014
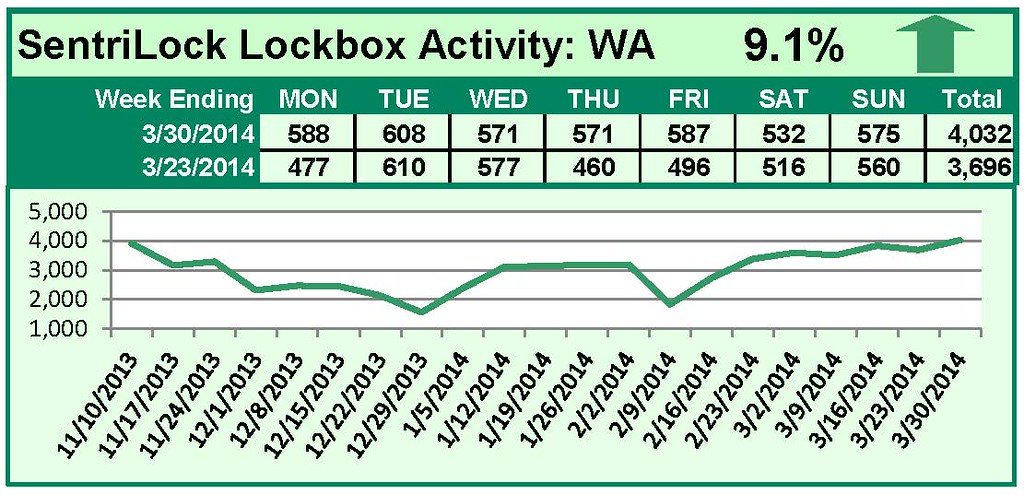
This Week’s Lockbox Activity
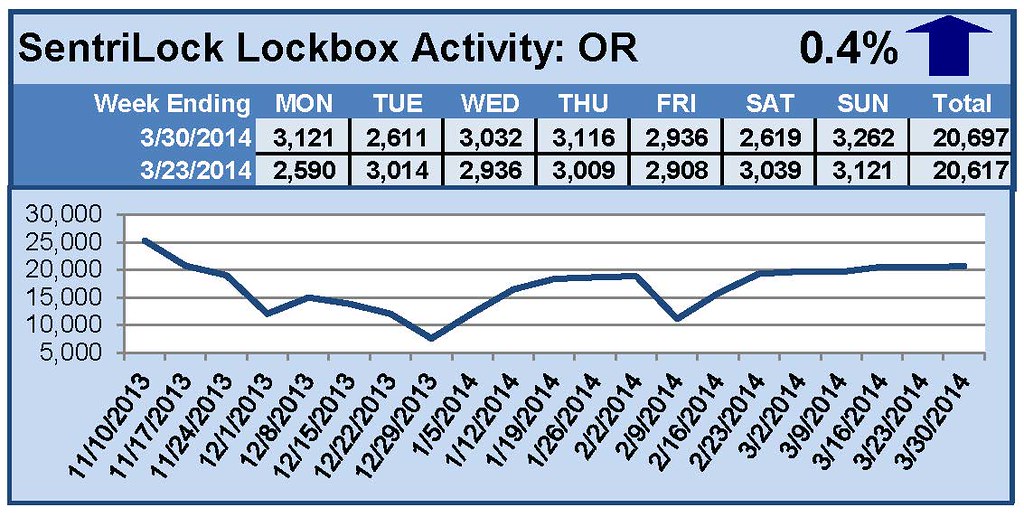
For the week of March 24-30, 2014, these charts show the number of times RMLS™ subscribers opened SentriLock lockboxes in Oregon and Washington. Showings in both Oregon and Washington rose this week.
For a larger version of each chart, visit the RMLS™ photostream on Flickr.
Please note: due to the RMLS™ transition to SentriLock, historical data is only currently available through the RMLS™ Flickr page, under the tag “Supra lockbox activity.” SentriLock data will continue accumulating until each chart represents a year of data.