by RMLS Communication Department | Feb 17, 2014

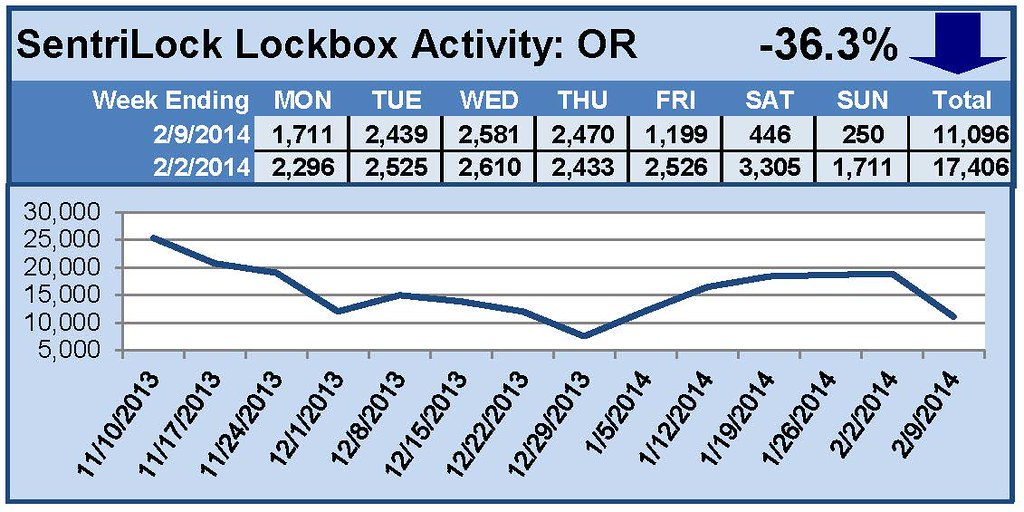
This Week’s Lockbox Activity
For the week of February 3-9, 2014, these charts show the number of times RMLS™ subscribers opened SentriLock lockboxes in Oregon and Washington. Activity fell sharply in both Oregon and Washington this week, likely due to the winter storm that descended upon the region over the weekend.
For a larger version of each chart, visit the RMLS™ photostream on Flickr.
Please note: due to the RMLS™ transition to SentriLock, historical data is only currently available through the RMLS™ Flickr page, under the tag “Supra lockbox activity.” SentriLock data will continue accumulating until each chart represents a year of data.
by RMLS Communication Department | Feb 10, 2014
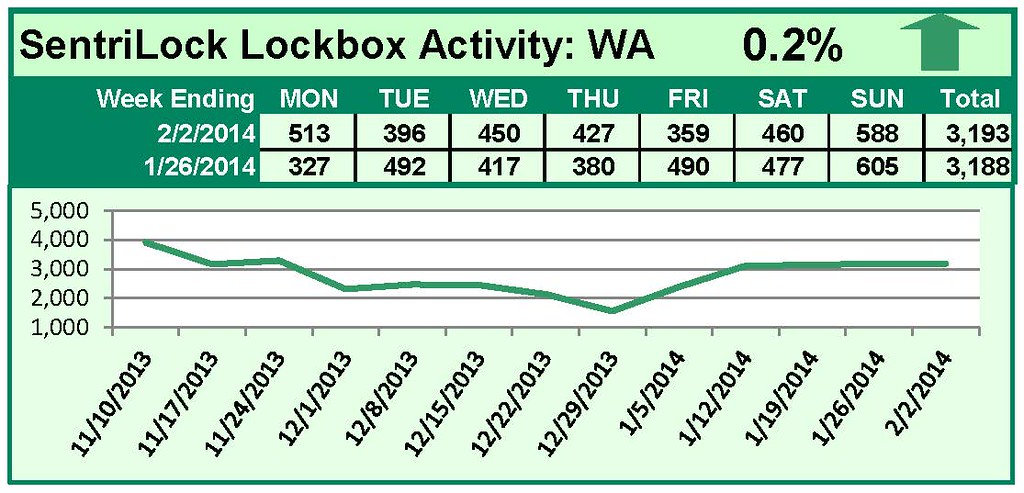
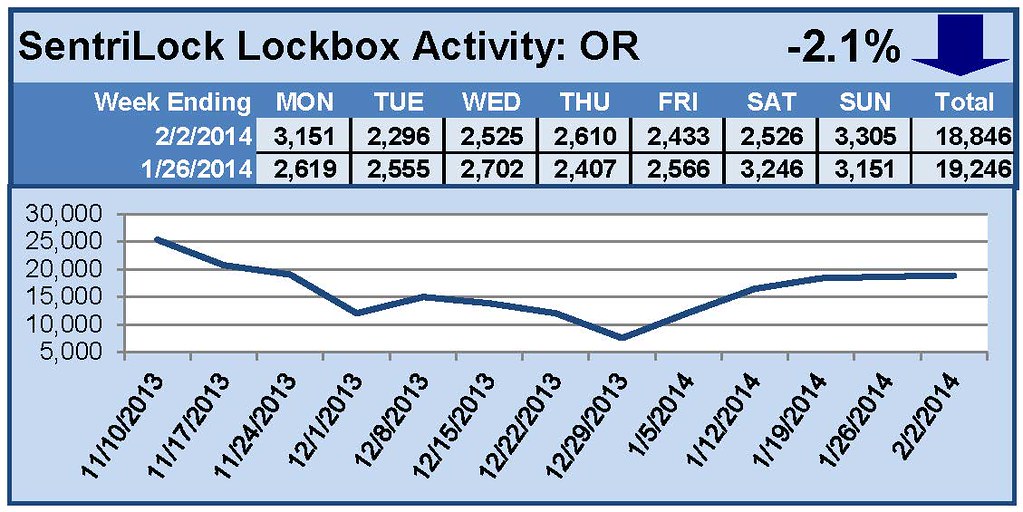
This Week’s Lockbox Activity
For the week of January 27-February 2, 2014, these charts show the number of times RMLS™ subscribers opened SentriLock lockboxes in Oregon and Washington. Activity increased slightly in Washington and fell in Oregon this week.
For a larger version of each chart, visit the RMLS™ photostream on Flickr.
Please note: due to the RMLS™ transition to SentriLock, historical data is only currently available through the RMLS™ Flickr page, under the tag “Supra lockbox activity.” SentriLock data will continue accumulating until each chart represents a year of data.
![2013 Distressed Residential Properties]()
by RMLS Communication Department | Feb 5, 2014
The chart below shows the number of bank owned/REO and short sales in all areas of the RMLS™ system during 2013.
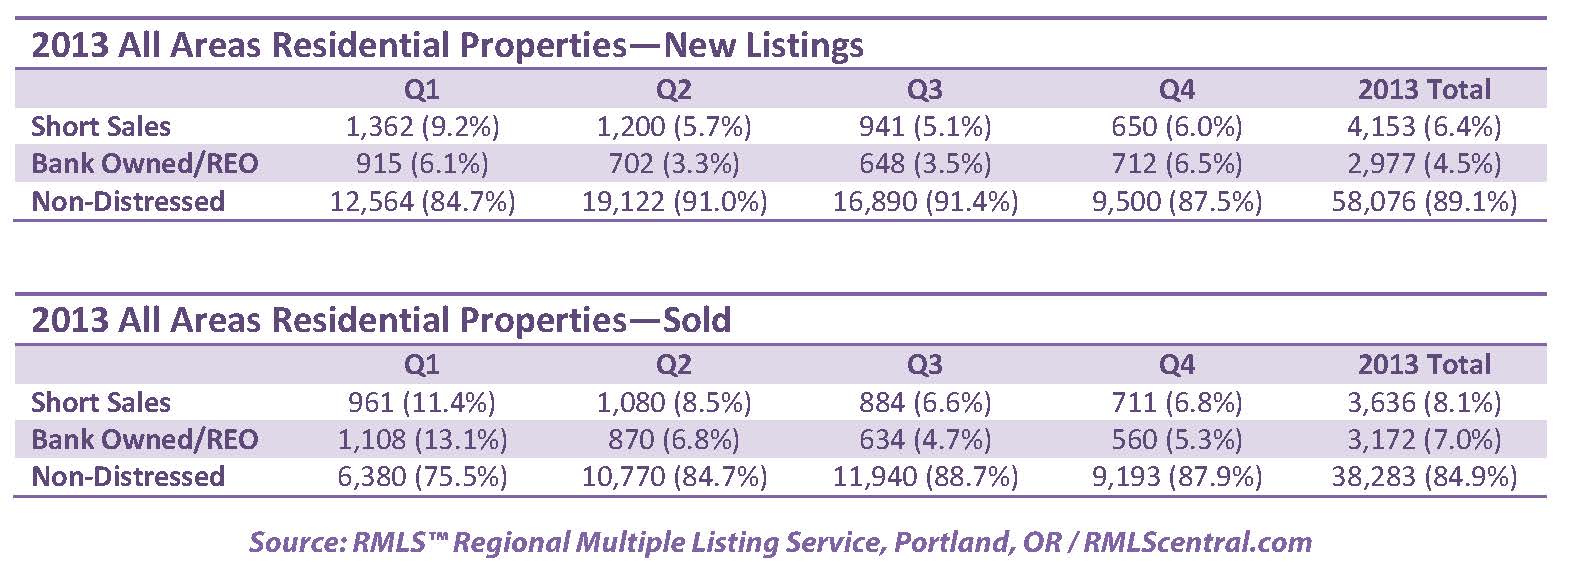
All areas when comparing percentage share of the market 2012 to 2013:
• Comparing 2012 to 2013, distressed sales as a percentage of closed sales decreased from 28.6% to 15.1%.
• New listings rose from 58,280 to 65,206 which is a 11.8% increase.
• Short sales comprised 6.4% of new listings and 8.1% of sold listings in 2013, down 4.9% and 4.0% from 2012 respectively as a percentage of the market.
• Bank owned/REO properties comprised 4.5% of new listings and 7.0% of sales in 2013, decreasing slightly from 10.3% and 16.5% respectively in 2012.
Portland metro when comparing percentage share of the market 2012 to 2013:
• Comparing 2012 to 2013, distressed sales as a percentage of closed sales decreased from 28.2% to 13.2%.
• New listings rose from 32,011 to 35,524 which is a 11.0% increase.
• Short sales comprised 6.4% of new listings and 8.0% of sold listings in 2013, down 5.7% and 4.3% from 2012 respectively as a percentage of the market.
• Bank owned/REO properties comprised 3.3% of new listings and 5.2% of sales in 2013, decreasing from 10.4% and 15.9% respectively in 2012.
Clark County when comparing percentage share of the market 2012 to 2013:
• Comparing 2012 to 2013, distressed sales as a percentage of closed sales decreased from 32.2% to 22.4%.
• New listings rose from 7,280 to 9,079 which is a 24.7% increase.
• Short sales comprised 10.0% of new listings and 12.7% of sold listings in 2013, down 9.1% and 5.8% from 2012 respectively as a percentage of the market.
• Bank owned/REO properties comprised 7.8% of new listings and 9.7% of sales in 2013, decreasing from 8.8% and 13.7% respectively in 2012.
Below are links to additional charts for some of our larger areas:
Portland Metro
Clark County, WA
Lane County, OR
Douglas County, OR
Coos County, OR
If you want information on percentages of distressed sales in other areas not represented by our charts, please contact us at communications@rmls.com.
by RMLS Communication Department | Feb 3, 2014
This Week’s Lockbox Activity
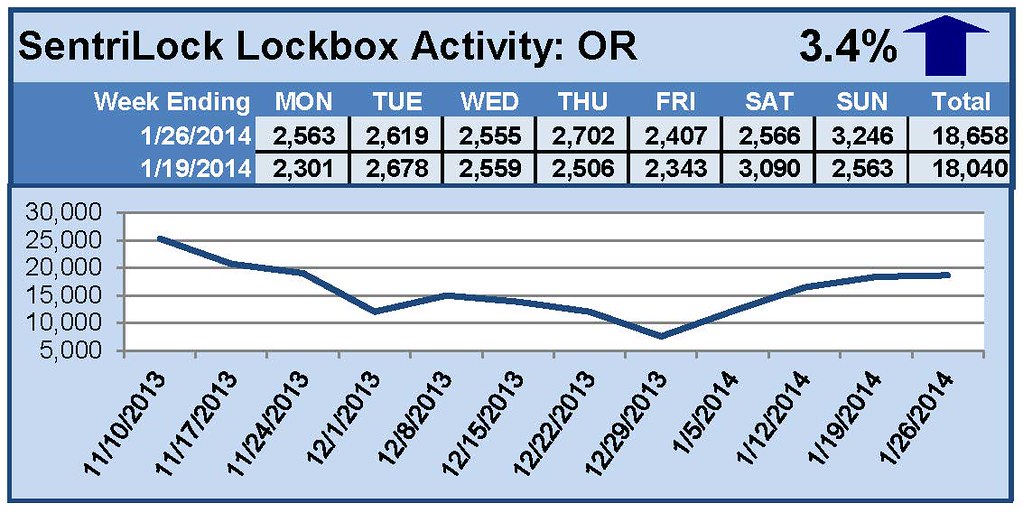
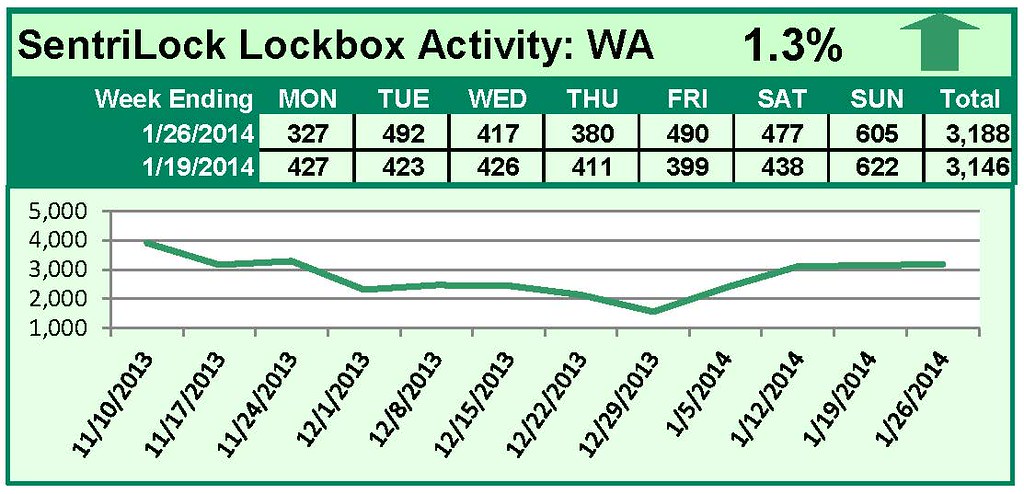
For the week of January 20-26, 2014, these charts show the number of times RMLS™ subscribers opened SentriLock lockboxes in Oregon and Washington. Both states saw increased activity this week.
For a larger version of each chart, visit the RMLS™ photostream on Flickr.
Please note: due to the RMLS™ transition to SentriLock, historical data is only currently available through the RMLS™ Flickr page, under the tag “Supra lockbox activity.” SentriLock data will continue accumulating until each chart represents a year of data.
by RMLS Communication Department | Jan 27, 2014

This Week’s Lockbox Activity
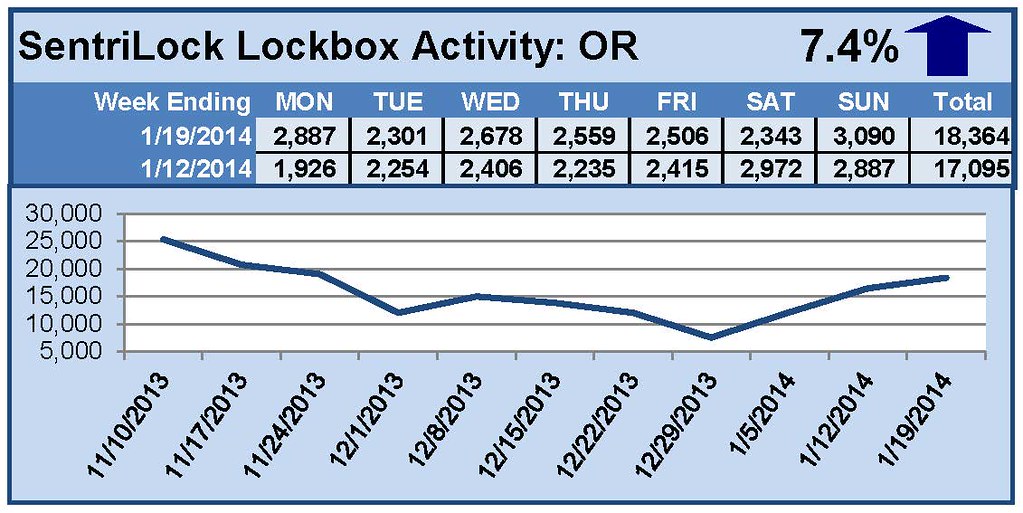
For the week of January 13-19, 2014, these charts show the number of times RMLS™ subscribers opened SentriLock lockboxes in Oregon and Washington. Showings rose in both states this week.
For a larger version of each chart, visit the RMLS™ photostream on Flickr.
Please note: due to the RMLS™ transition to SentriLock, historical data is only currently available through the RMLS™ Flickr page, under the tag “Supra lockbox activity.” SentriLock data will continue accumulating until each chart represents a year of data.
![2013 Distressed Residential Properties]()
by RMLS Communication Department | Jan 22, 2014
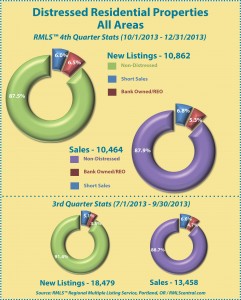 This chart shows the number of bank owned/REO properties and short sales in all areas of the RMLS™ system during the fourth quarter of 2013.
Below are links to additional charts for some of our larger areas.
• Portland Metro Distressed Properties (4th Quarter 2013)
• Clark County, WA Distressed Properties (4th Quarter 2013)
• Lane County, OR Distressed Properties (4th Quarter 2013)
• Douglas County, OR Distressed Properties (4th Quarter 2013)
• Coos County, OR Distressed Properties (4th Quarter 2013)
Here are some additional facts about distressed residential properties in the fourth quarter of 2013:
All areas when comparing percentage share of the market, fourth quarter 2013 to third quarter 2013:
• When comparing the fourth quarter 2013 to third quarter 2013, distressed sales as a percentage of new listings increased by 3.9% (12.5 v. 8.6%).
• In a comparison of the fourth quarter 2013 to third quarter 2013, distressed sales as a percentage of closed sales increased by 0.8% (12.1 v. 11.3%).
• Short sales comprised 6.0% of new listings and 6.8% of sales in the fourth quarter of 2013, up 0.9% and 0.2% from the third quarter of 2013, respectively.
• Bank owned/REO properties comprised 6.5% of new listings and 5.3% of sales in the fourth quarter of 2013, up 3.0% and 0.6% from the third quarter of 2013, respectively.
Portland Metro when comparing percentage share of the market, fourth quarter 2013 to third quarter 2013:
• When comparing the fourth quarter 2013 to third quarter 2013, distressed sales as a percentage of new listings increased by 3.1% (10.6% v. 7.5%).
• In a comparison of fourth quarter 2013 to third quarter 2013, distressed sales as a percentage of closed sales increased by 1.4% (10.8% v. 9.4%).
• Short sales comprised 6.0% of new listings and 7.2% of sales in the fourth quarter of 2013, up 0.7% and 0.9% from the third quarter of 2013, respectively.
• Bank owned/REO properties comprised 4.6% of new listings and 3.6% of sales in the fourth quarter of 2013, up 2.4% and 0.5% from the third quarter of 2013, respectively.
Clark County when comparing percentage share of the market, fourth quarter 2013 to third quarter 2013:
• When comparing the fourth quarter 2013 to third quarter 2013, distressed sales as a percentage of new listings increased by 4.7% (18.6% v. 13.9%).
• In a comparison of fourth quarter 2013 to third quarter 2013, distressed sales as a percentage of closed sales decreased by 1.9% (17.6% v. 19.5%).
• Short sales comprised 8.2% of new listings and 9.1% of sales in the fourth quarter of 2013, up 0.6% for new listings and down 2.0% for sales when compared to the third quarter of 2013, respectively.
• Bank owned/REO properties comprised 10.4% of new listings and 8.5% of sales in the fourth quarter of 2013, up 4.1% and up 0.1% from the third quarter of 2013, respectively.
If you’d like more information or percentages of distressed residential sales in other areas not represented by our charts, please contact us at communications@rmls.com.