![Real Talk with RMLS, Episode 5: Statistics on RMLSweb]()
by RMLS Communication Department | Jun 28, 2017
Beth Raimer hosts Real Talk with RMLS, a podcast designed for REALTOR® subscribers to get the scoop about all things RMLS.
This week, Tyler Chaudhary discusses statistical information available through Market Action and other reports on RMLSweb.
Music: “The Major Trend” by AG Music (via MelodyLoops.com)
![Real Talk with RMLS, Episode 5: Statistics on RMLSweb]()
by RMLS Communication Department | Aug 29, 2014
This post is part of MLS Insight, a series about how things work at RMLS™.
In our early years, RMLS™ leadership had the goal of positioning RMLS™ as the primary source for information about the residential real estate market—so statistical information has always been a priority. Then and now, RMLS™ provides compiled data and directs media to working REALTORS® for interpretation and projections.
In other words, our expertise is the WHAT, and we leave the WHY to industry professionals who have access to the buyers and sellers whose activity underpins the data on sales, prices, and listings.
Market Action
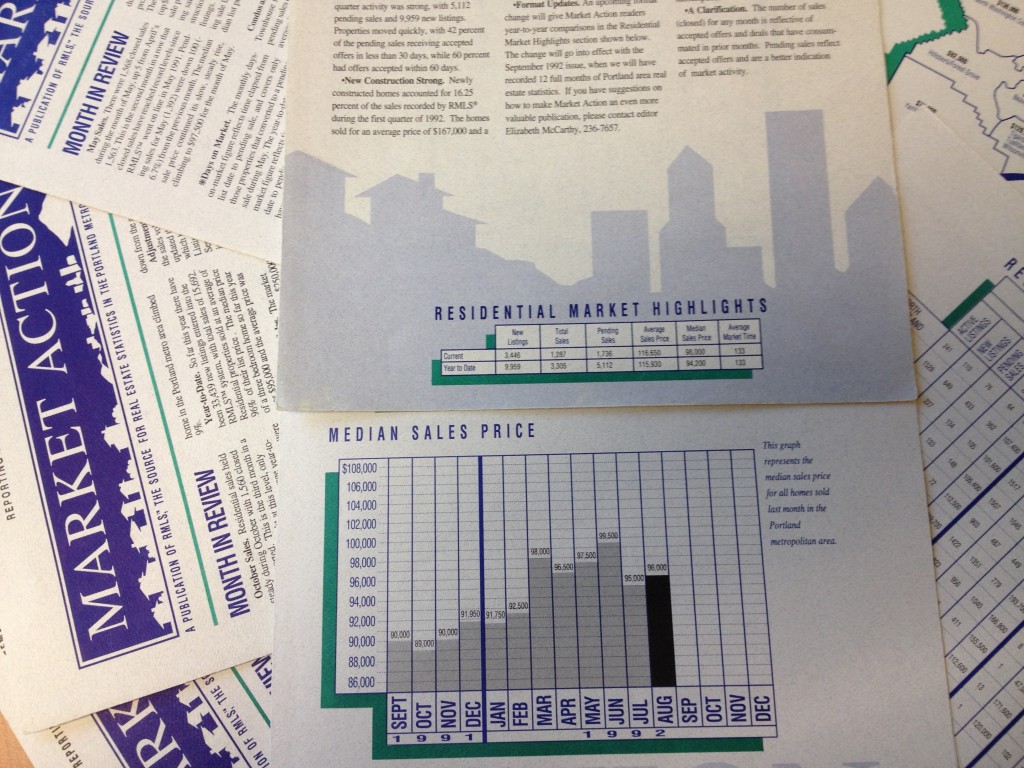
The first issue of our monthly statistical newsletter, Market Action, was published as four printed pages in March 1992. Today Market Action is 69 pages long and covers all the market areas we serve. Next year, we will be expanding coverage to include separate stats for new construction and existing homes. Watch for a survey question in our Annual Subscriber Satisfaction Survey to weigh in on the most important data to include, or leave a comment below.
Market Trends and Market Stats
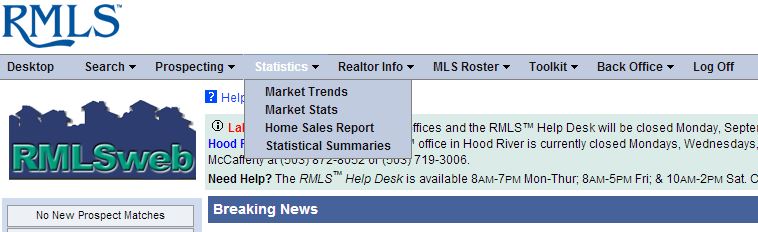
To explore the other statistics reports that RMLS™ has to offer, head to the Statistics tab on the RMLSweb menu bar.
RMLSweb also features video tutorials on how to use both Market Trends and Market Stats. (You can find these and others on RMLSweb by clicking on Training Tutorials under the Toolkit menu.)
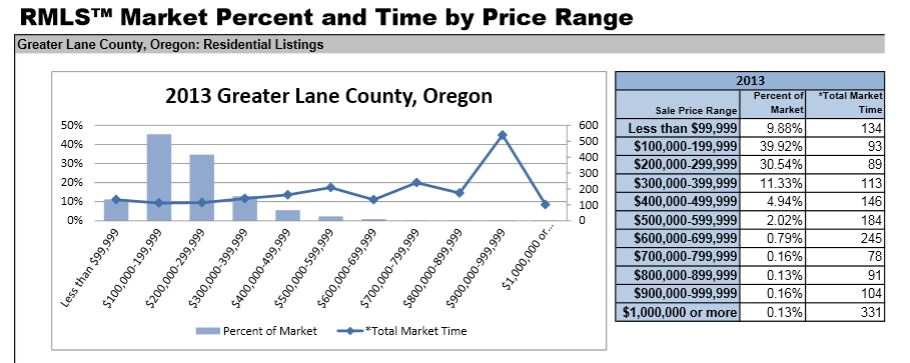
Market Trends allows searching by geography (area number, city, ZIP code) and a few other criteria such as bedrooms, year built, lot size, etc. The resulting report produces not only a summary of data by month within the range you select, but also six graphs like the one below that are a click away from copying for your use in your own CMAs or newsletters.
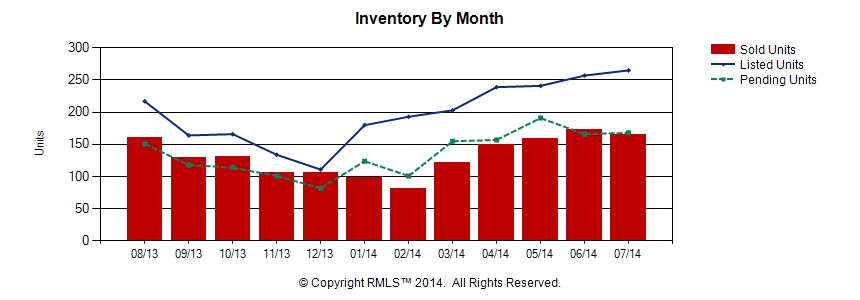
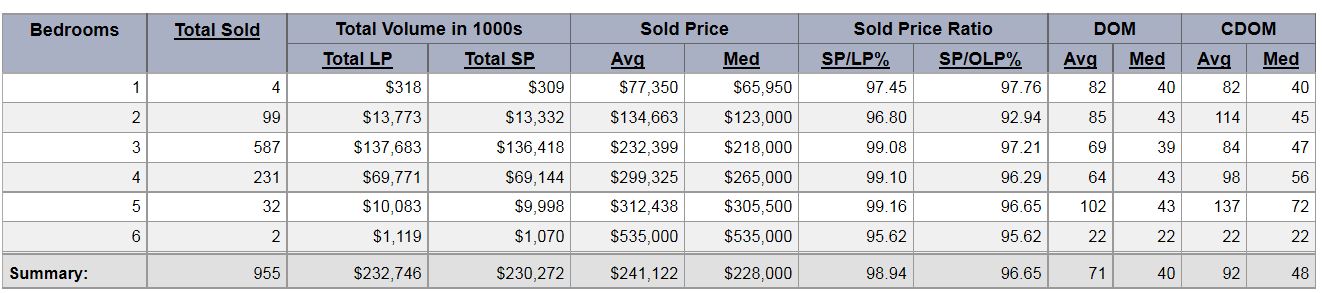
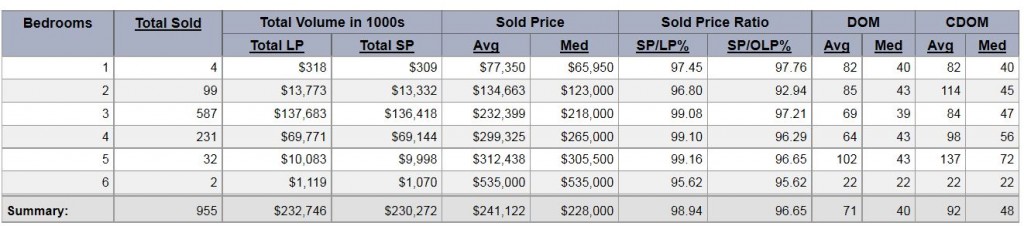
Market Stats provides several reports. The Comparables Report has several additional graphs which depict sales data by sold terms and number of bedrooms. (See below for the type of info available in the Comparables Report.) The Dollar Value by Area and Inventory Reports are strictly data reports that give a very streamlined overview of market areas.
Home Sales Report
In addition to these dynamic reports which pull data according to criteria you select, RMLS™ also provides static reports under the Statistics menu. The Home Sales Report has information as early as 2001. Since July 2011, these reports have presented information for new construction—both separate from existing and combined.
Statistical Summaries
Finally, the Statistical Summaries compile years worth of Market Action historical data into a few pages and provide up to nine annual snapshots of various aspects of the residential real estate market in all our market areas. Access them under the Statistics menu on RMLSweb.
As you can see, RMLS™ takes stats seriously! If you would like to learn more about how to use stats in your business, call RMLS™ Training at (503) 236-7657 to get more information.
Thanks for taking this brief tour highlighting some of the statistical information available from RMLS™. Next month we will talk about envisioning an MLS without area numbers. If you have any questions you would like to have answered about how things work at RMLS™, I encourage you to post a comment to this blog.
by RMLS Communication Department | Dec 15, 2009
Sales up, but in comparison to a dismal month last November
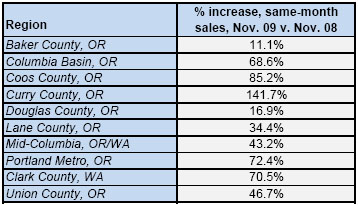
The big highlight this month for many areas is a large jump in closed sales compared to last November. Curry County posted a 141.7% increase and Portland and Clark County set records for percentage increases in same-month sales at 72.4% and 70.5%, respectively.
While these stats are obviously a good sign for market activity, continue to keep in mind that last year we were at the height of the economic crisis and we hit some of the lowest points in sales totals in recent years. So, yes, sales are way up compared to last year, but remember that we’re comparing it to unusually low sales totals.
Has the winter slowdown arrived?
Closed sales had been on the rise in many key areas month-to-month through October, but it appears that the winter slowdown has arrived. Compared to this October, pending and closed sales were down in most areas, including Columbia Basin, Douglas County, Lane County, the Mid-Columbia region, Portland and Clark County.
Inventory up
Inventory ticked up in every area except Curry County and Union County, however, most areas are well below last year’s inventory levels thanks to fewer listings entering the market and higher sales totals. For example, Portland’s inventory stands at 7.1 months – 53% less than last November’s 15 months of inventory.
by RMLS Communication Department | Oct 22, 2009
Top 5 Areas with the Lowest Housing Inventory in September, Portland & Clark County
Below are the five MLS areas with the lowest supply of housing inventory for September 2009 for the Clark County and Portland metro areas. Inventory measures how long, in theory, it would take to exhaust the current supply of housing. We arrive at this number by dividing the number active listings by the number of sales for the month.
Clark County
| Area |
Area # |
Actives |
Sales |
Inventory |
| Lincoln/Hazel Dell |
14 |
34 |
10 |
3.4 |
| Five Corners |
25 |
89 |
18 |
4.9 |
| East Orchards |
26 |
90 |
18 |
5.0 |
| Cascade Park |
24 |
105 |
20 |
5.3 |
| Evergreen |
22 |
276 |
51 |
5.4 |
Portland Metro
| Area |
Area # |
Actives |
Sales |
Inventory |
| Beaverton/Aloha |
150 |
1,007 |
204 |
4.9 |
| NE Portland |
142 |
1,016 |
185 |
5.5 |
| North Portland |
141 |
455 |
75 |
6.1 |
| Southeast Portland |
143 |
1,396 |
228 |
6.1 |
| Hillsboro/Forest Grove |
152 |
880 |
142 |
6.2 |