![Housing Market Recovery by the Numbers]()
by RMLS Communication Department | Aug 7, 2013

Click to enlarge
The RMLS™ Inventory Today chart on the desktop of RMLSweb showed that total sales volume for a twelve month period topped $12 billion on July 16th this year. The last time the sales volume was at that level was almost five years ago on September 8, 2008, with volume still on its way down to its low point reached in 2011.
While prices are currently increasing rapidly, they still have a way to go to reach their previous levels. The $12 billion volume in 2008 required only 39,456 sales at an average price of $304,443. The number of sales represented by the $12 billion this year was 46,901 with an average price of $255,942.
The housing market recovery has encompassed all of the RMLS™ market areas in Oregon and southern Washington to varying degrees, which the monthly Market Action reports demonstrate. Momentum is accelerating!
by RMLS Communication Department | Nov 13, 2009
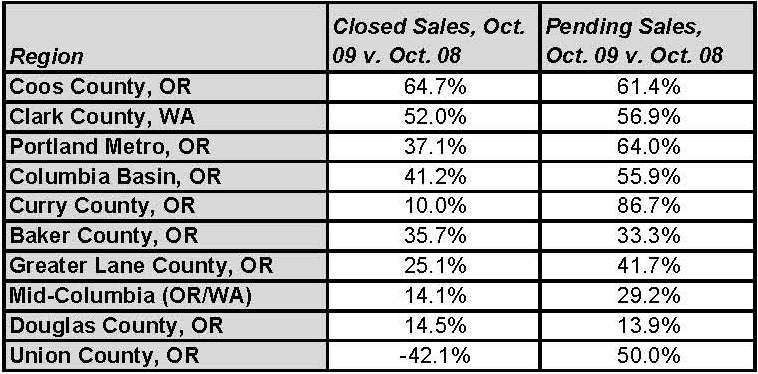
Same-month sales up nearly across the board in Oregon & Southern Washington
Sales activity continued to outpace levels from the same month last year in the latest RMLS™ Market Action report. Inventory was also down in several areas, including Lane County, Portland and Clark County.
Sales Activity:
Both pending and closed sales increased in 9 out of 10 of the regions that we cover when compared to the same month in 2008. The Portland metro area saw its largest increase in closed sales since January 2005 , which was also the highest total of closed sales since August 2007. Clark County set a record for pending sales, with an increase of 56.9% compared to last October. Here’s a recap of each region’s same-month sales activity:
It will be interesting to see if this trend of increased sales activity will continue this fall and winter season. The percentage increases were not surprising this month, given the recent strength in sales and considering that last year we saw sales begin to drop in October, kicking off a stretch of slow sales activity that would extend into the first quarter of 2009.
Inventory:
Housing inventory levels dropped in several key areas, including Lane County (6.2 months), Portland (6.5 months, lowest since August 2007) and Clark County (6.4 months, lowest since September 2006). This is somewhat counterintuitive, as inventory levels have often increased as we head into the slower fall and winter seasons. But, considering the following factors, it’s no surprise:
- Low interest rates
- New listings continue to drop in most areas, reducing the supply of homes available
- The perceived tax credit deadline (which has since been extended)
- Lower home prices
What do you think?
Realtors – what do you think? Where do you see the market heading? Have you heard increased interest from buyers and sellers since the tax credit extension/expansion? Comment below!

by RMLS Communication Department | Sep 8, 2009
When to Expect the Latest Market Reports from RMLS™
This is a frequently asked question from subscribers here in my cubicle, so I thought I’d put the answer in writing.
My standard line is that Market Action is released around the 15th of each month. “Around” means it could be a day or two before, or a day or two after. It all depends on where the weekend falls.
We don’t generate any statistical reports for Market Action until the 10th day of each month. The reason we wait is to assure that almost all transactions are recorded in our database. If we were to run the reports on the 1st or 5th of each month, there’s a chance that many sales that occurred in the prior month might not be reported on RMLSweb yet. So, to assure what we report is an accurate reflection of what happened in the market that month, we wait until the 10th.
Editing time.
However, sometimes due to where the weekend falls, we can’t start working on the reports until the 11th, 12th, or sometimes even the 13th. Generating the reports, publishing, editing, posting and e-mailing then takes roughly 2.5 days of work.
So, for example, this month, I’ll start working on Thursday the 10th. But, I have to pause for the weekend, so the likely release date is Monday, September 14 or Tuesday, September 15.
Tip: If you’re eager to see the data, you can get a basic report on RMLSweb on the 11th of each month. The Home Sales Report (HSR) has a lot of the same data that we report in Market Action (number of sales, sale price, active listings).
The HSR can be accessed on RMLSweb by scrolling over Back Office and clicking on Home Sales Report. Then expand the folder for the year that you want, then the month, and then select the area you want to look at. If you want to look at the report for a broad area (such as the Portland Metro area), open the document that reads “combined report”. You can also look at reports for individual MLS areas or counties.
