RMLS™ Appraiser Co-authors Article on Square Footage Analysis

RMLS™ subscriber and appraiser Ralph Olsen has co-authored a paper with Dr. Scott Wallace of Washington State University in Vancouver. Hidden Dangers in Sale Price Per Square Foot Analysis discusses the dangers of using price per square foot as the sole means for valuing a particular property. REALTORS® should gain insight to appraisers’ methodology and why this common practice can provide misleading results!

Read Hidden Dangers in Sale Price Per Square Foot Analysis by Ralph Olsen and Dr. Scott Wallace.


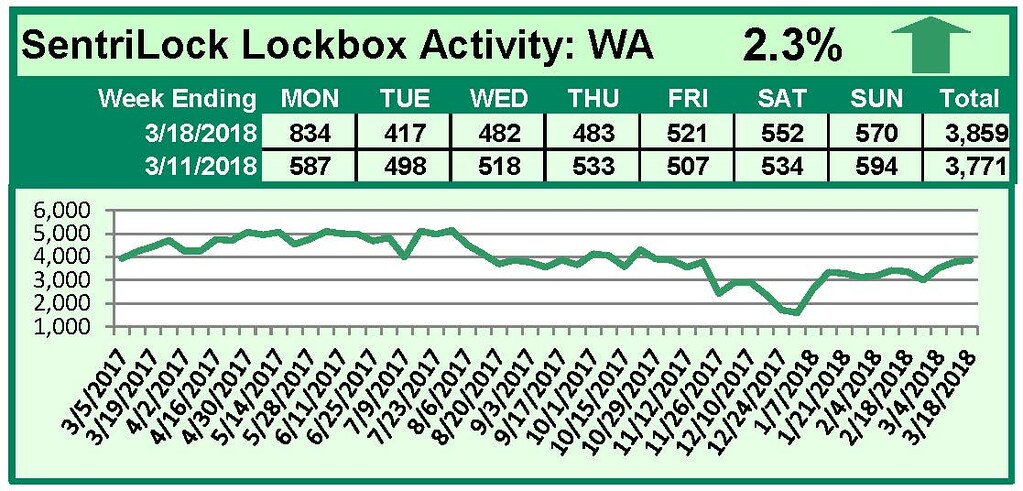
SentriLock Lockbox Activity March 12-18, 2018

This Week’s Lockbox Activity

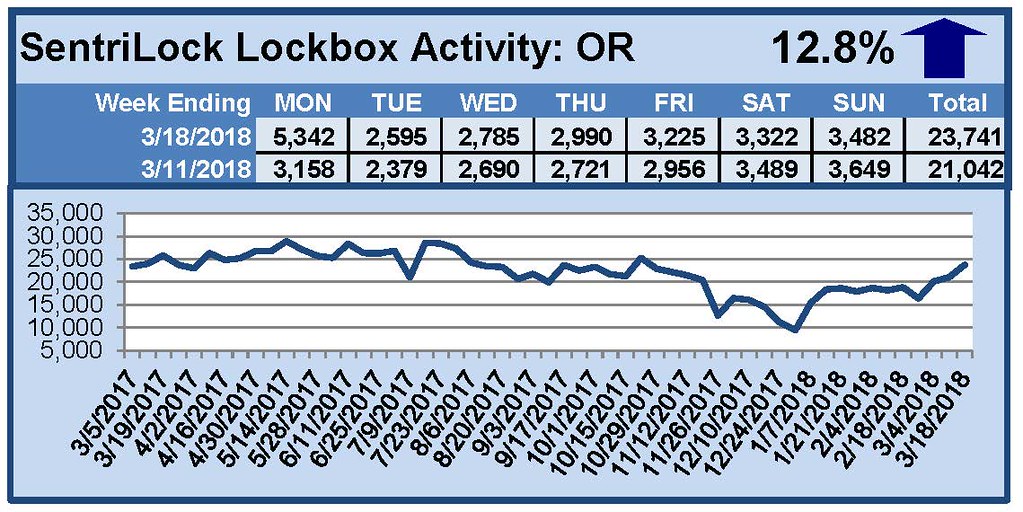
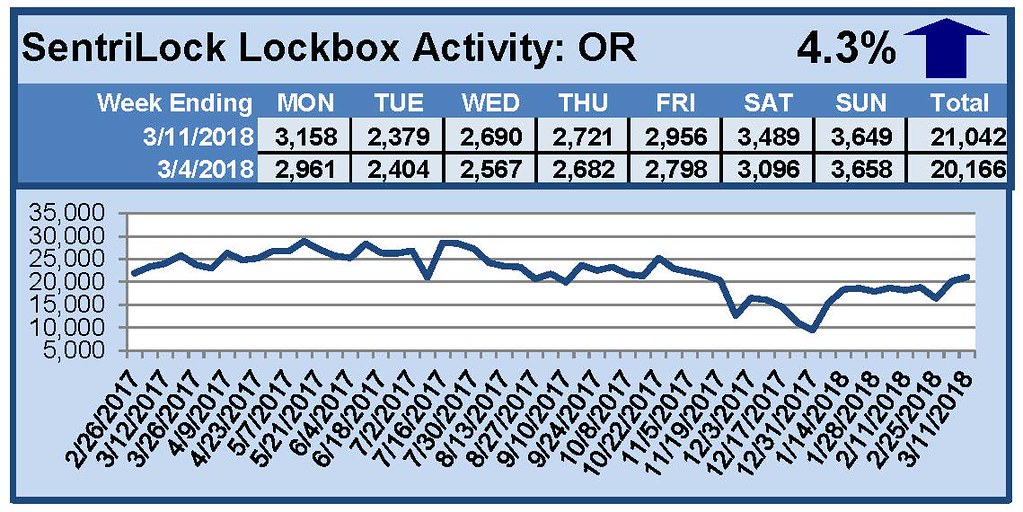
For the week of March 12-18, 2018, these charts show the number of times RMLS™ subscribers opened SentriLock lockboxes in Oregon and Washington. Activity increased in both Oregon and Washington this week.

For a larger version of each chart, visit the RMLS™ photostream on Flickr.


SentriLock Lockbox Activity March 5-11, 2018

This Week’s Lockbox Activity

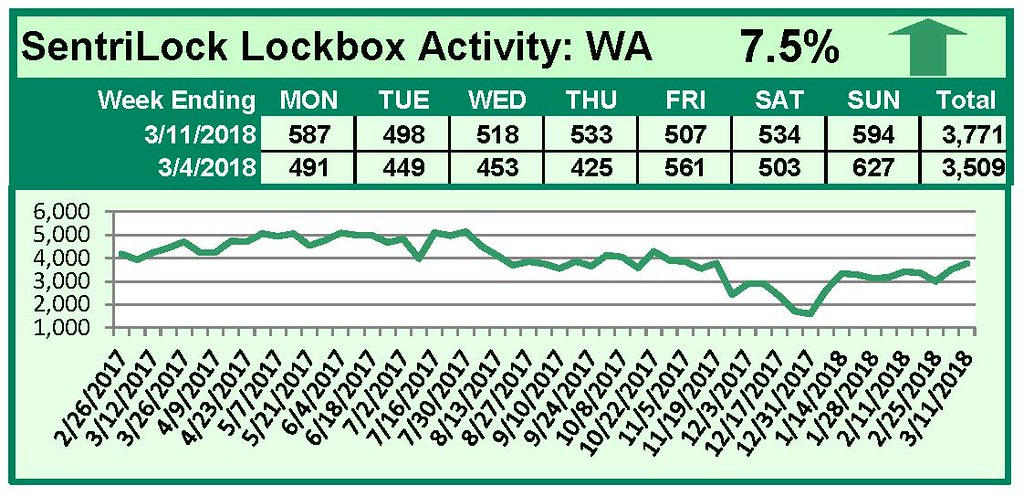
For the week of March 5-11, 2018, these charts show the number of times RMLS™ subscribers opened SentriLock lockboxes in Oregon and Washington. Activity increased in both Oregon and Washington this week.

For a larger version of each chart, visit the RMLS™ photostream on Flickr.


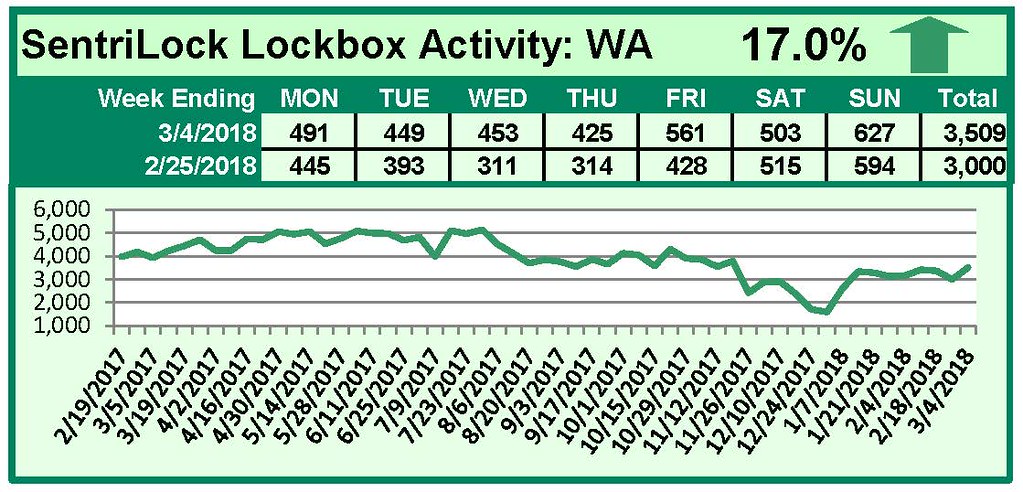
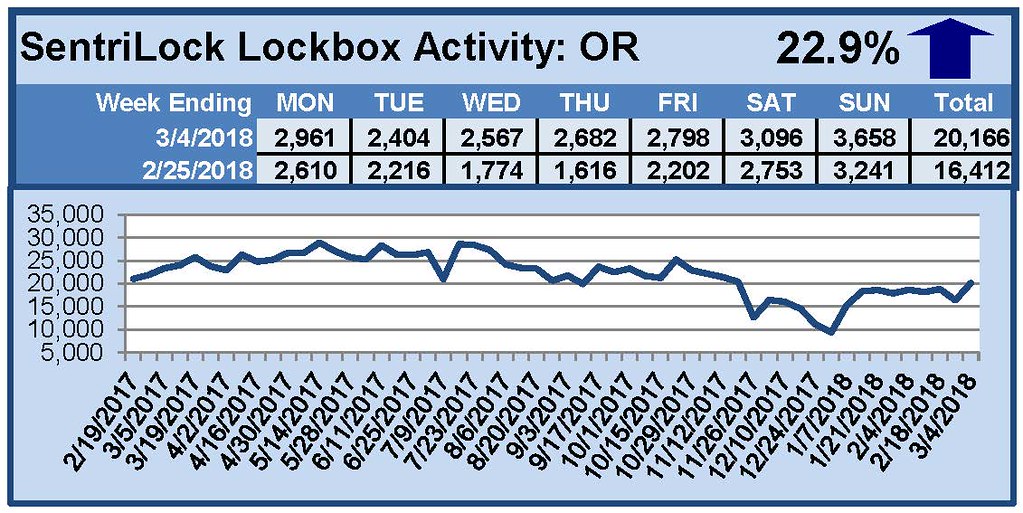
SentriLock Lockbox Activity February 26-March 4, 2018

This Week’s Lockbox Activity

For the week of February 26-March 4, 2018, these charts show the number of times RMLS™ subscribers opened SentriLock lockboxes in Oregon and Washington. Activity increased in both Oregon and Washington this week.

For a larger version of each chart, visit the RMLS™ photostream on Flickr.


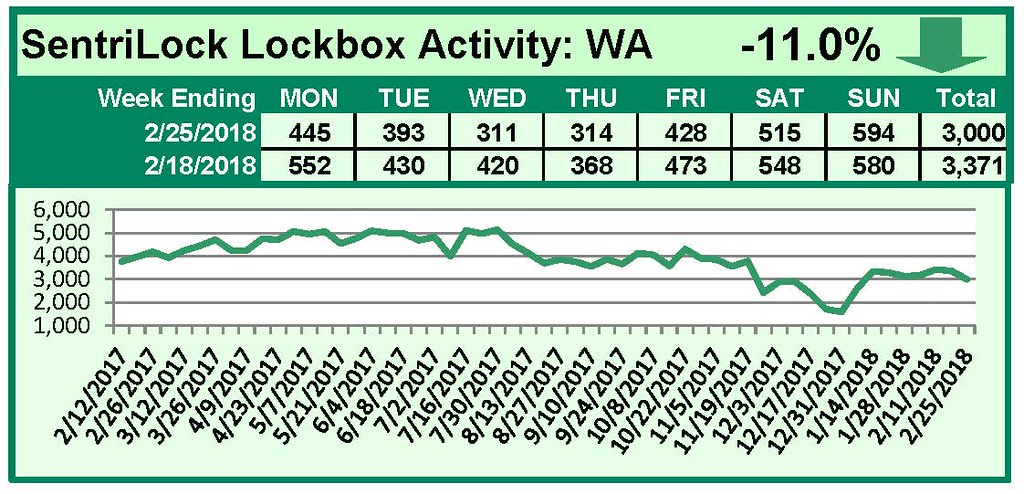
SentriLock Lockbox Activity February 19-25, 2018

This Week’s Lockbox Activity

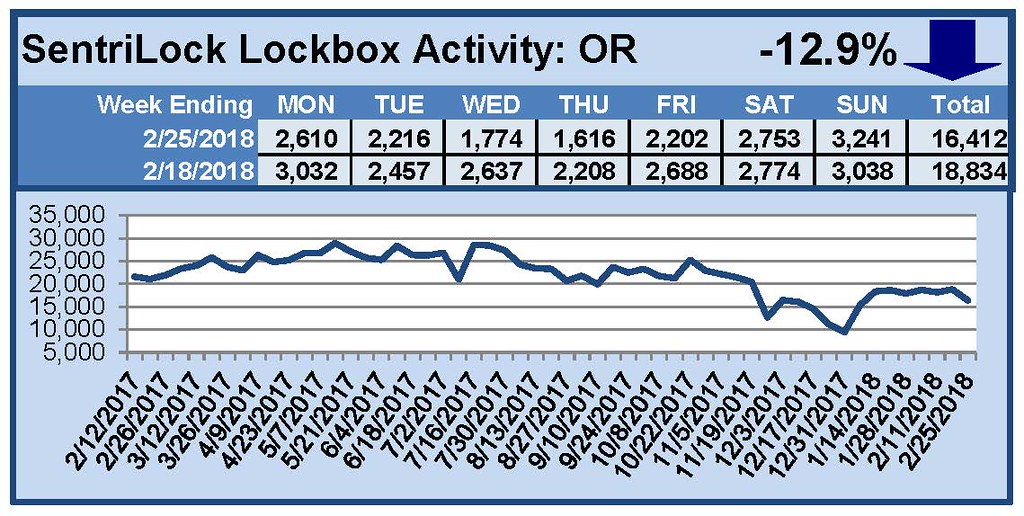
For the week of February 19-25, 2018, these charts show the number of times RMLS™ subscribers opened SentriLock lockboxes in Oregon and Washington. Activity decreased in both Oregon and Washington this week.

For a larger version of each chart, visit the RMLS™ photostream on Flickr.


SentriLock Lockbox Activity February 12-18, 2018

This Week’s Lockbox Activity

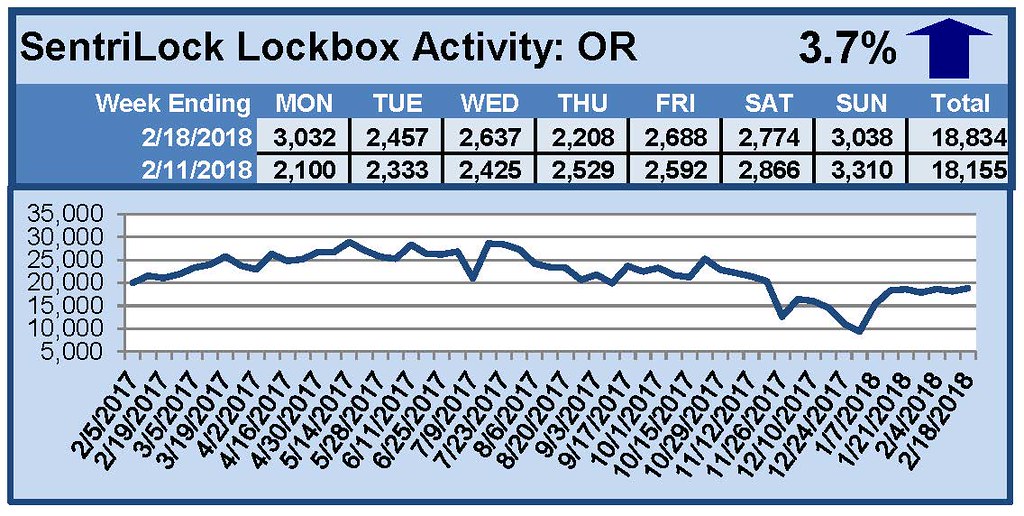
For the week of February 12-18, 2018, these charts show the number of times RMLS™ subscribers opened SentriLock lockboxes in Oregon and Washington. Activity increased in Oregon and decreased in Washington this week.

For a larger version of each chart, visit the RMLS™ photostream on Flickr.


SentriLock Lockbox Activity February 4-11, 2018

This Week’s Lockbox Activity

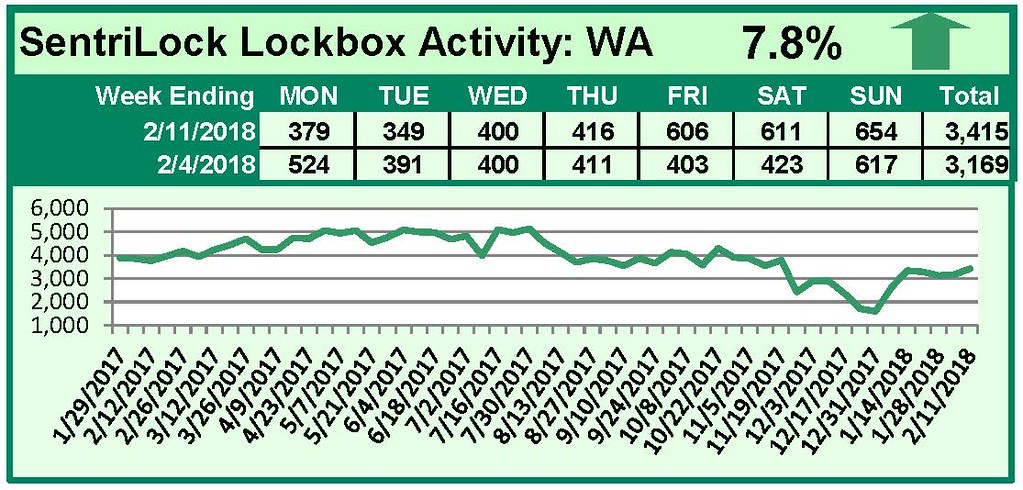
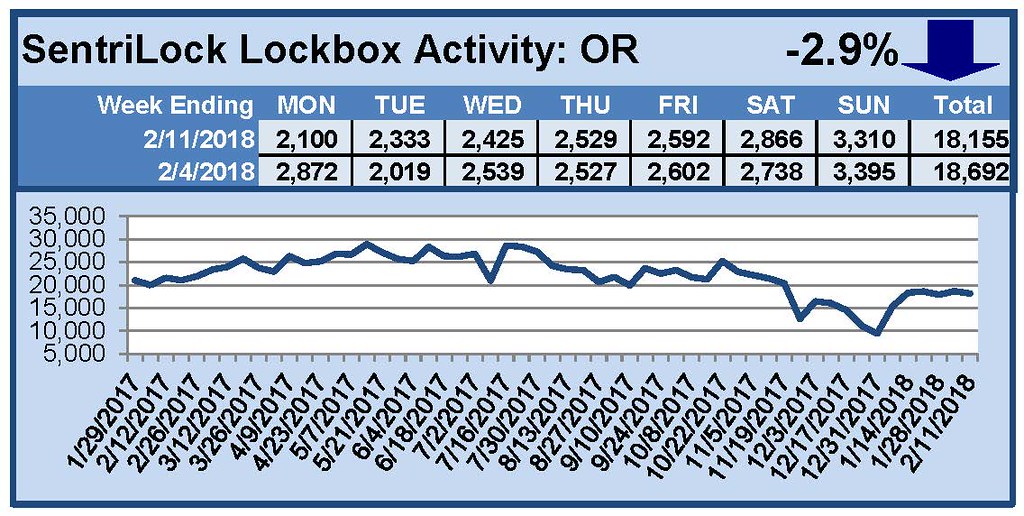
For the week of February 4-11, 2018, these charts show the number of times RMLS™ subscribers opened SentriLock lockboxes in Oregon and Washington. Activity increased in Washington and decreased in Oregon this week.

For a larger version of each chart, visit the RMLS™ photostream on Flickr.


SentriLock Lockbox Activity January 29-February 4, 2018

This Week’s Lockbox Activity

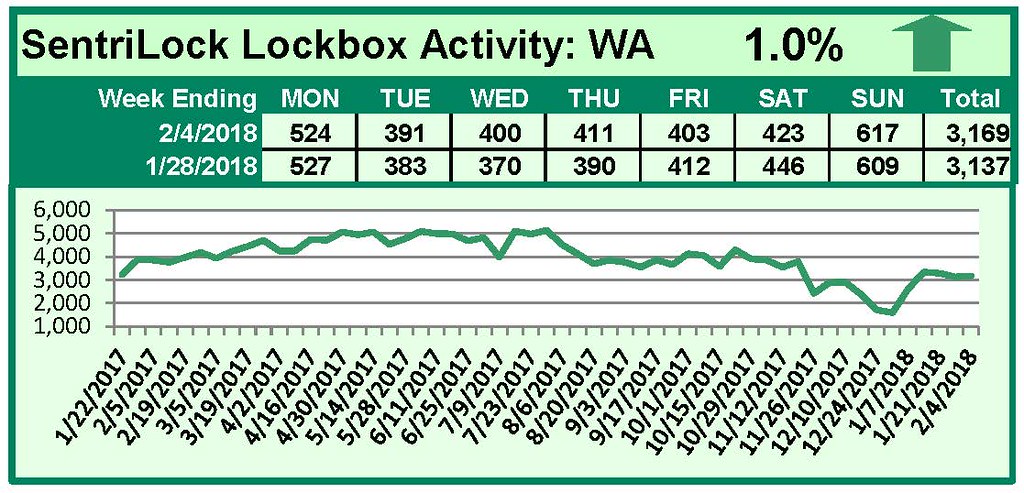
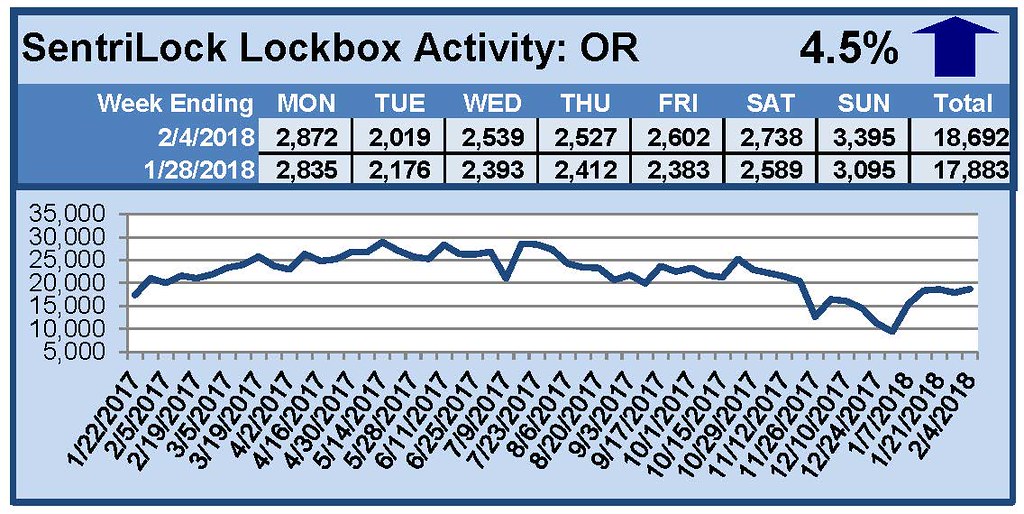
For the week of January 29-February 4, 2018, these charts show the number of times RMLS™ subscribers opened SentriLock lockboxes in Oregon and Washington. Activity rose in both states this week.

For a larger version of each chart, visit the RMLS™ photostream on Flickr.


SentriLock Lockbox Activity January 22-28, 2018

This Week’s Lockbox Activity

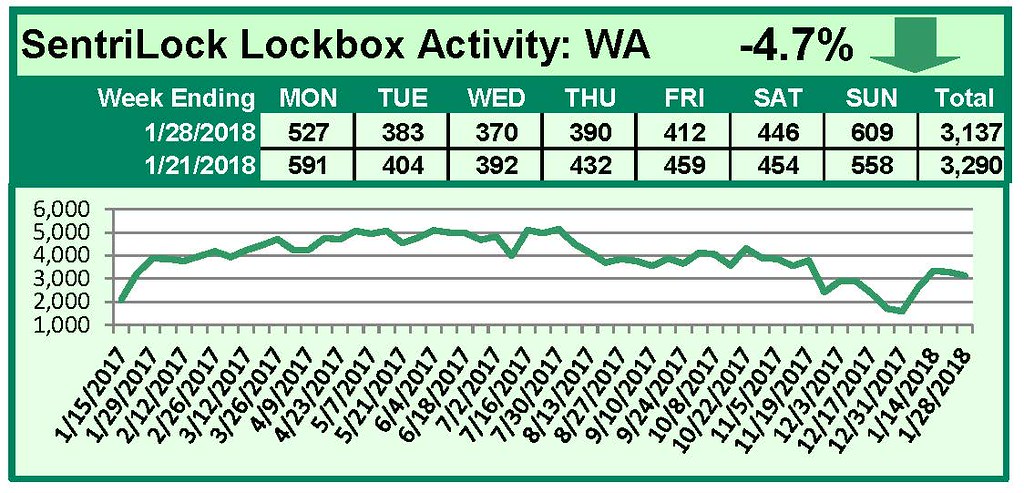
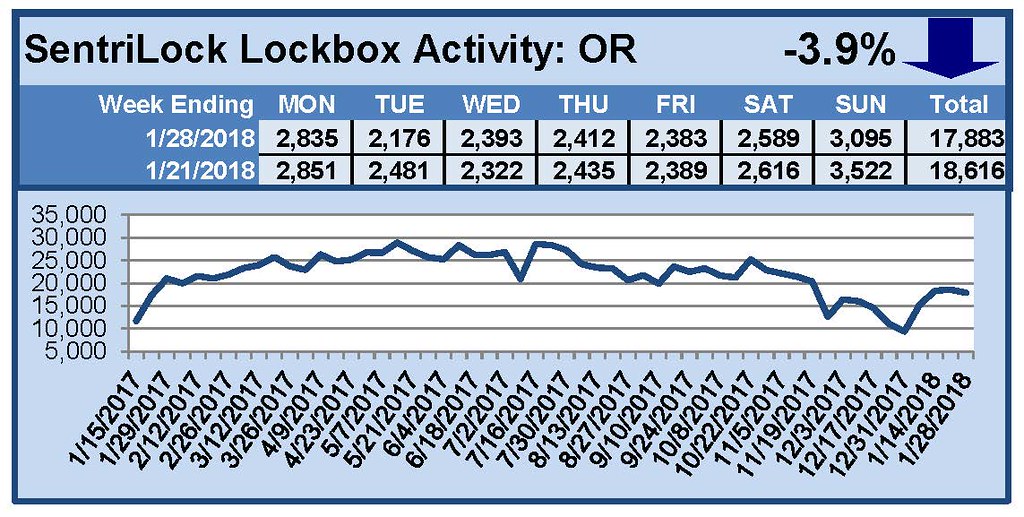
For the week of January 22-28, 2018, these charts show the number of times RMLS™ subscribers opened SentriLock lockboxes in Oregon and Washington. Washington and Oregon both saw a decrease in activity this week.

For a larger version of each chart, visit the RMLS™ photostream on Flickr.


SentriLock Lockbox Activity January 15-21, 2018

This Week’s Lockbox Activity

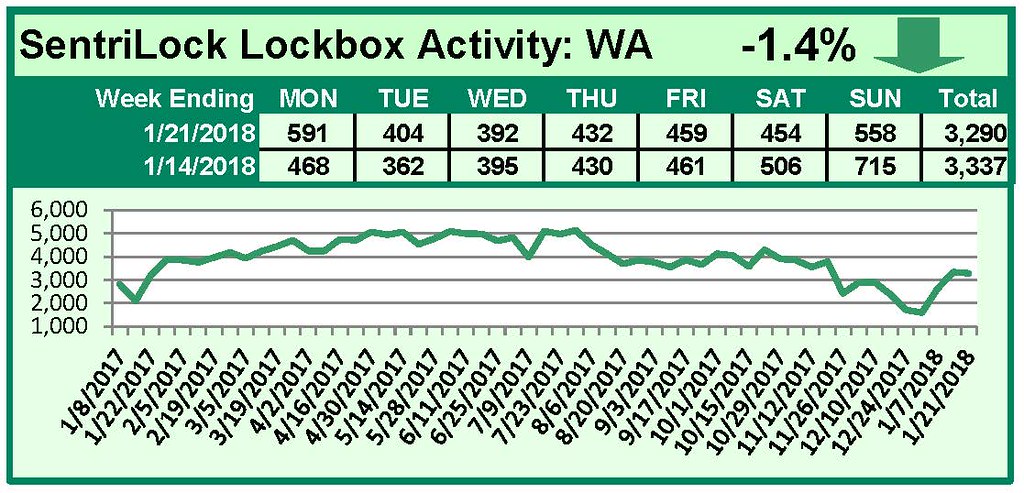
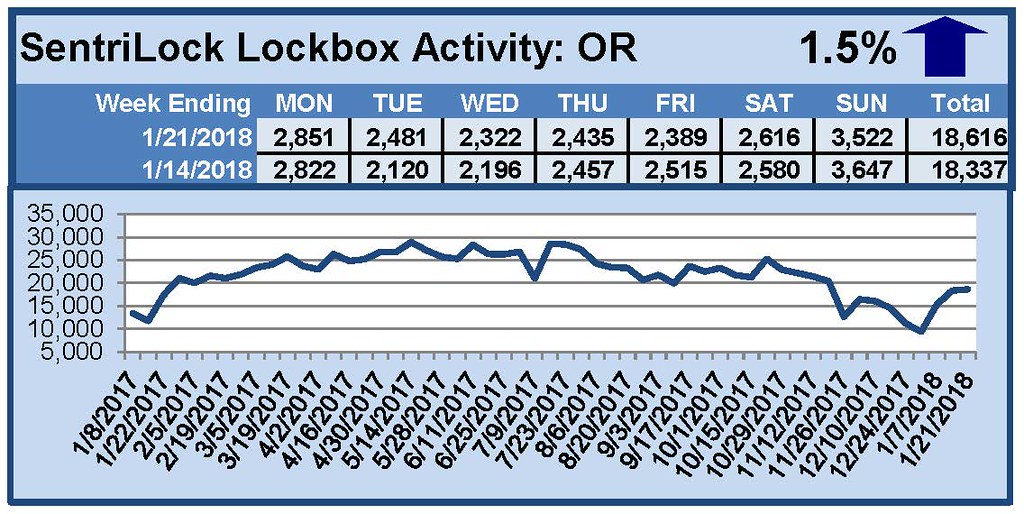
For the week of January 15-21, 2018, these charts show the number of times RMLS™ subscribers opened SentriLock lockboxes in Oregon and Washington. Washington saw a decrease in activity this week, while activity rose in Oregon.

For a larger version of each chart, visit the RMLS™ photostream on Flickr.