SentriLock Lockbox Activity January 12-18, 2015

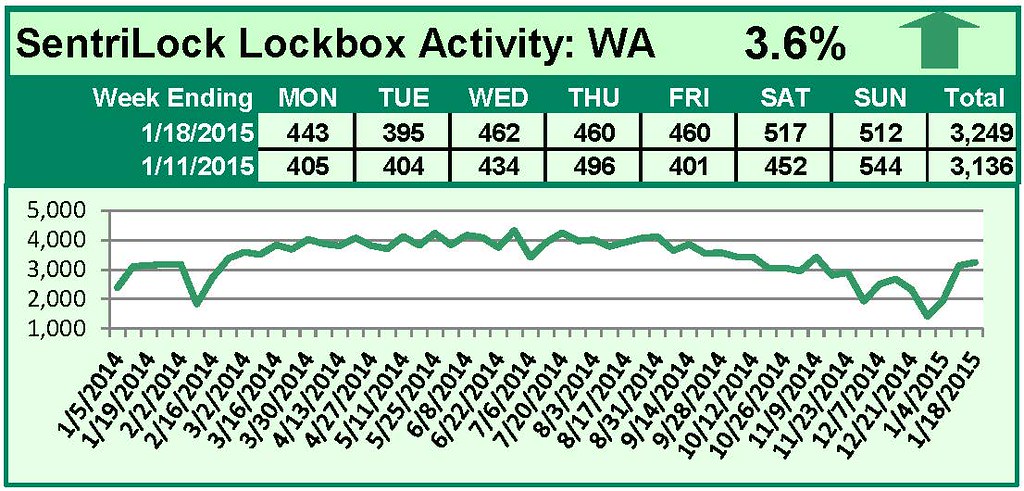
This Week’s Lockbox Activity

For the week of January 12-18, 2015, these charts show the number of times RMLS™ subscribers opened SentriLock lockboxes in Oregon and Washington. Washington and Oregon both saw an increase in activity this week.

For a larger version of each chart, visit the RMLS™ photostream on Flickr.


2014 Distressed Residential Properties

The chart below shows the number of bank owned/REO and short sales in all areas of the RMLS™ system during 2014.

ALL AREAS 2014 Distressed PropertiesAll areas when comparing percentage share of the market 2013 to 2014:
• Comparing 2013 to 2014, distressed sales as a percentage of closed sales decreased from 15.1% to 10.4%.
• New listings increased from 65,206 to 68,291, which is a 4.7% increase.
• Short sales comprised 3.3% of new listings and 4.1% of sold listings in 2014, down 3.1% and 4.0% from 2013 respectively as a percentage of the market.
• Bank owned/REO properties comprised 5.2% of new listings and 6.3% of sales in 2014, increasing from 4.5% and decreasing from 7.0%, respectively, in 2013.

Portland metro when comparing percentage share of the market 2013 to 2014:
• Comparing 2013 to 2014, distressed sales as a percentage of closed sales decreased from 13.2% to 8.6%.
• New listings rose from 35,524 to 37,283, which is a 4.9% increase.
• Short sales comprised 3.3% of new listings and 3.9% of sold listings in 2014, down 3.1% and 4.1% from 2013 respectively as a percentage of the market.
• Bank owned/REO properties comprised 4.2% of new listings and 4.7% of sales in 2014, increasing from 3.3% and decreasing from 5.2%, respectively, in 2013.

Clark County when comparing percentage share of the market 2013 to 2014:
• Comparing 2013 to 2014, distressed sales as a percentage of closed sales decreased from 22.4% to 14.6%.
• New listings rose from 9,079 to 9,607, which is a 5.8% increase.
• Short sales comprised 4.7% of new listings and 6.2% of sold listings in 2014, down 5.3% and 6.5% from 2013 as a percentage of the market.
• Bank owned/REO properties comprised 5.8% of new listings and 8.4% of sales in 2014, decreasing from 7.8% and 9.7% respectively in 2013.

Below are links to additional charts for some of our larger areas:
Portland Metro Area
Clark County, WA
Lane County, OR
Douglas County, OR
Coos County, OR

If you want information on percentages of distressed sales in other areas not represented by our charts, please contact us at communications@rmls.com.


Residential Distressed Properties for Fourth Quarter (October-December) 2014

AllAreas4QDistressedSM

This chart shows the number of bank owned/REO properties and short sales in all areas of the RMLS™ system during the fourth quarter of 2014.

Below are links to additional charts for some of our larger areas.
Portland Metro Area Distressed Properties (4th Quarter 2014)
Clark County, WA Distressed Properties (4th Quarter 2014)
Lane County, OR Distressed Properties (4th Quarter 2014)
Douglas County, OR Distressed Properties (4th Quarter 2014)
Coos County, OR Distressed Properties (4th Quarter 2014)

Here are some additional facts about distressed residential properties in the fourth quarter of 2014:

All areas when comparing percentage share of the market, fourth quarter 2014 to third quarter 2014:
• When comparing the fourth quarter 2014 to third quarter 2014, distressed sales as a percentage of new listings increased by 4.9% (12.0 v. 7.1%).
• In a comparison of the fourth quarter 2014 to third quarter 2014, distressed sales as a percentage of closed sales increased by 0.7% (9.5 v. 8.8%).
• Short sales comprised 3.5% of new listings and 3.0% of sales in the fourth quarter of 2014, up 0.9% and down 0.3% from the third quarter of 2014, respectively.
• Bank owned/REO properties comprised 8.5% of new listings and 6.5% of sales in the fourth quarter of 2014, up 4.0% and 1.0% from the third quarter of 2014, respectively.

Portland metro when comparing percentage share of the market, fourth quarter 2014 to third quarter 2014:
• When comparing the fourth quarter 2014 to third quarter 2014, distressed sales as a percentage of new listings increased by 4.5% (10.7 v. 6.2%).
• In a comparison of fourth quarter 2014 to third quarter 2014, distressed sales as a percentage of closed sales increased by 1.0% (8.2 v. 7.2%).
• Short sales comprised 3.8% of new listings and 2.9% of sales in the fourth quarter of 2014, up 1.2% and down 0.4% from the third quarter of 2014, respectively.
• Bank owned/REO properties comprised 6.9% of new listings and 5.3% of sales in the fourth quarter of 2014, up 3.3% and 1.4% from the third quarter of 2014, respectively.

Clark County when comparing percentage share of the market, fourth quarter 2014 to third quarter 2014:
• When comparing the fourth quarter 2014 to third quarter 2014, distressed sales as a percentage of new listings increased by 3.9% (12.7 v. 8.8%).
• In a comparison of fourth quarter 2014 to third quarter 2014, distressed sales as a percentage of closed sales increased by 0.4% (11.5 v. 11.1%).
• Short sales comprised 4.4% of new listings and 4.3% of sales in the fourth quarter of 2014, up 0.6% for new listings and down 0.4% for sales when compared to the third quarter of 2014, respectively.
• Bank owned/REO properties comprised 8.3% of new listings and 7.2% of sales in the fourth quarter of 2014, up 3.3% and 0.8% from the third quarter of 2014, respectively.

If you’d like more information or percentages of distressed residential sales in other areas not represented by our charts, please contact us at communications@rmls.com.


SentriLock Lockbox Activity January 5-11, 2015

This Week’s Lockbox Activity

For the week of January 5-11, 2015, these charts show the number of times RMLS™ subscribers opened SentriLock lockboxes in Oregon and Washington. Activity increased in both Oregon and Washington this week.

For a larger version of each chart, visit the RMLS™ photostream on Flickr.


SentriLock Lockbox Activity December 29, 2014-January 4, 2015

This Week’s Lockbox Activity

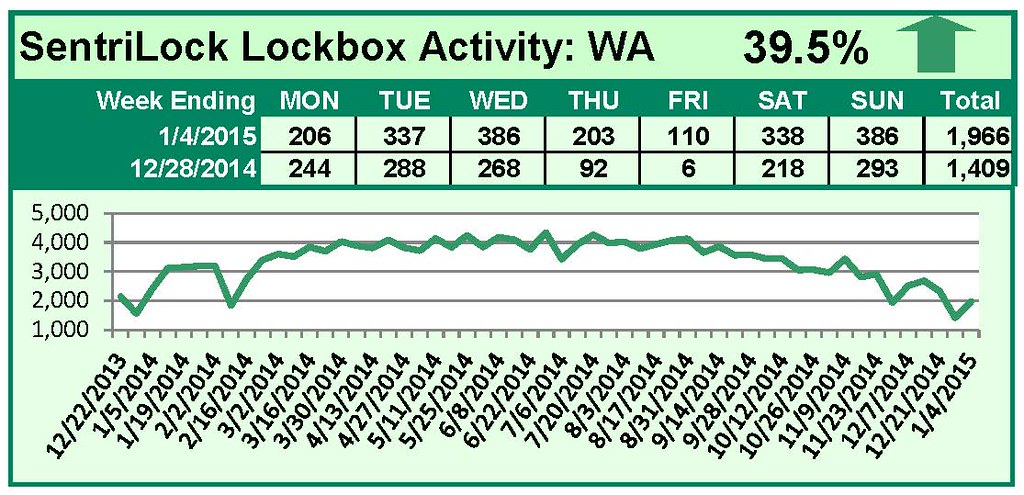
For the week of December 29, 2014-January 4, 2015, these charts show the number of times RMLS™ subscribers opened SentriLock lockboxes in Oregon and Washington. Activity rebounded in both states this week.

For a larger version of each chart, visit the RMLS™ photostream on Flickr.


Fair Housing Testing: What Is It?

fhco_logoFollowing is a guest post by Jo Becker, Education/Outreach Specialist for the Fair Housing Council of Oregon.

The topic of fair housing testing strikes fear and incites anger in many within the housing industry—independent landlords and professional property managers, sales brokers, mortgage lenders, homeowners’ associations, and other housing providers. Most are very unclear what testing is, and what it isn’t.

First, let me say that as a former REALTOR®, I am well aware that the housing industry is heavily regulated. Legal issues and accompanying regulatory bodies range from licensing law to fair housing law. The Fair Housing Council of Oregon (FHCO) is not the only organization that performs testing. Those familiar with the sales world, you might recall when the Oregon Real Estate Agency (OREA) conducted audit tests a few years ago to verify that agents were explaining the then-new Agency Disclosure Pamphlet and presenting it for signature upon “first substantive contact” with a prospective client. This is one more example of testing in the industry.

What is Fair Housing Testing?
Who does it? What are the implications for you in your daily practice?

FHCO is not an enforcement agency. We do however conduct enforcement-related activities such as testing or filing a complaint with the Department of Housing and Urban Development (HUD) or another regulatory governmental agency (such as Oregon’s Bureau of Labor and Industries), either on our own behalf or in assisting a housing consumer who feels a fair housing violation has been committed against them. We also sometimes file lawsuits with private attorneys, especially if testing evidence supports an allegation of a fair housing violation. Each year we also assist hundreds of housing providers and consumers in resolving fair housing problems in an informal manner, to the satisfaction of both parties. A good deal of our day-to-day work focuses on education and outreach to both housing consumers and housing providers about their rights and responsibilities under federal, state, and local fair housing laws (see a list of FHCO classes).

If someone contacts our office with what appears may be a fair housing allegation, we take the information and determine if it is a testable situation. Testing is used to identify ordinary business practices (of a company, an individual, etc) and these practices are usually confirmed with a series of tests. We may use testers who are not simply posing as a housing consumer, but someone who may follow a transaction through to the end and purchase a home, obtain a loan, enter into a lease agreement, etc. These folks aren’t just testers, they’re bonafide prospects currently in the market to buy/lend/lease.

We’d much rather eradicate illegal discrimination through education and making ourselves available for your questions than to “catch” you doing something wrong. Consider us a resource. Did you know that we provide testing as a fee-for-service? Organizations and firms may contract with us to see how staff or members are doing in complying with fair housing laws—the results of these tests are confidential under the terms of the contract.

We also offer a wealth of information available for housing providers on our website. A few pages likely to be of interest:
Housing Provider Information
Guidebooks
Public Service Videos
Sample Forms
Brochures
Translated Materials

Please consider supporting the work we do by joining FHCO today. Support from the housing industry is particularly important as we stand together to ensure housing for all in the spirit of fair housing laws.


SentriLock Lockbox Activity December 22-28, 2014

NOTE: Charts updated January 5, 2015 at 10:22am.

This Week’s Lockbox Activity

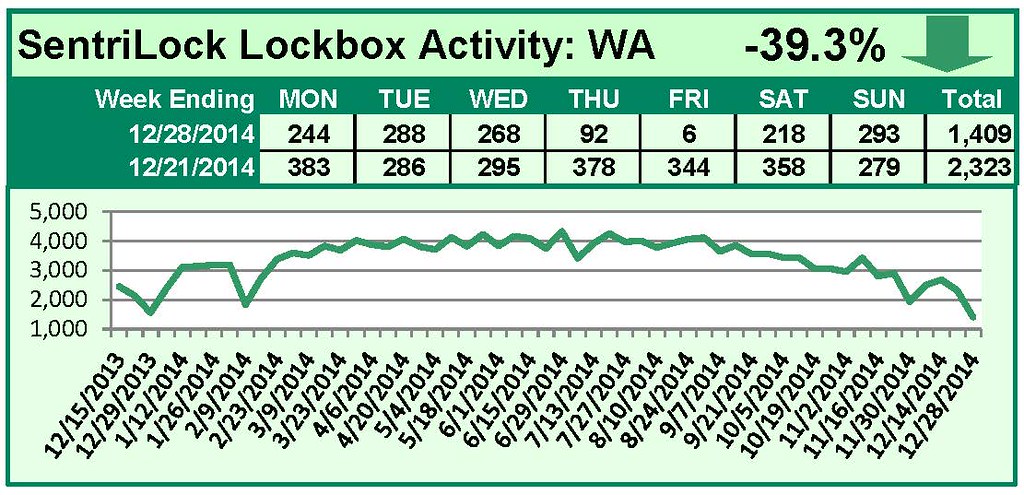
For the week of December 22-28, 2014, these charts show the number of times RMLS™ subscribers opened SentriLock lockboxes in Oregon and Washington. Activity decreased in both states this week.

For a larger version of each chart, visit the RMLS™ photostream on Flickr.


SentriLock Lockbox Activity December 15-21, 2014

This Week’s Lockbox Activity

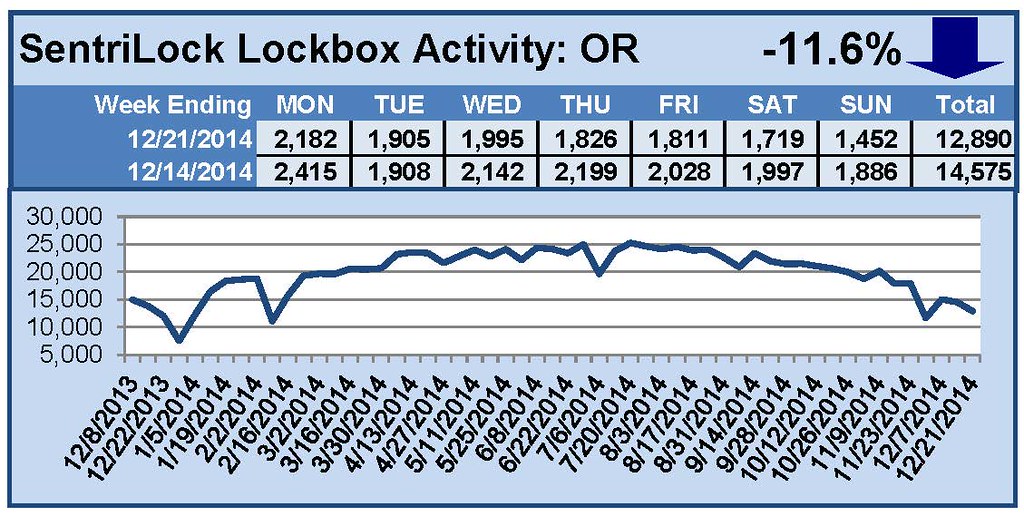
For the week of December 15-21, 2014, these charts show the number of times RMLS™ subscribers opened SentriLock lockboxes in Oregon and Washington. Activity decreased in both states this week.

For a larger version of each chart, visit the RMLS™ photostream on Flickr.


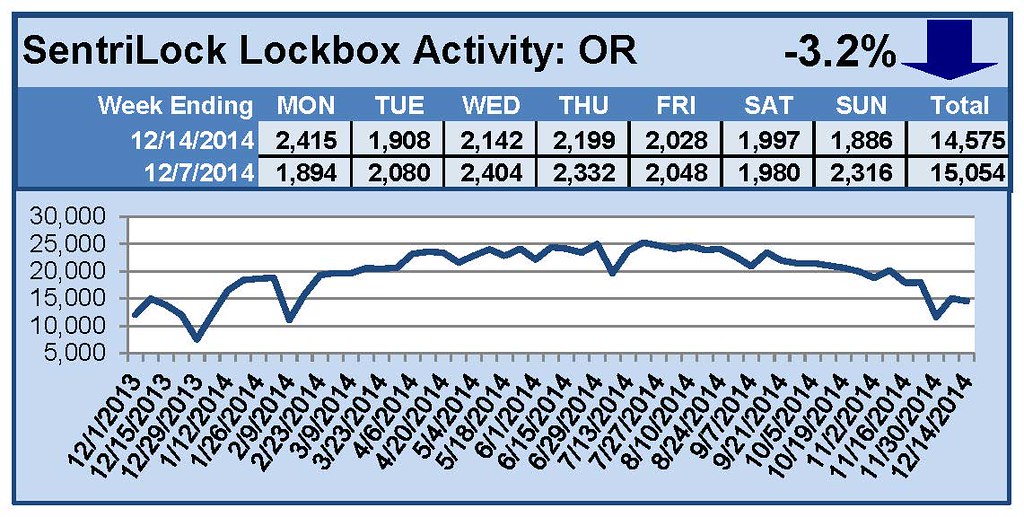
SentriLock Lockbox Activity December 8-14, 2014

This Week’s Lockbox Activity

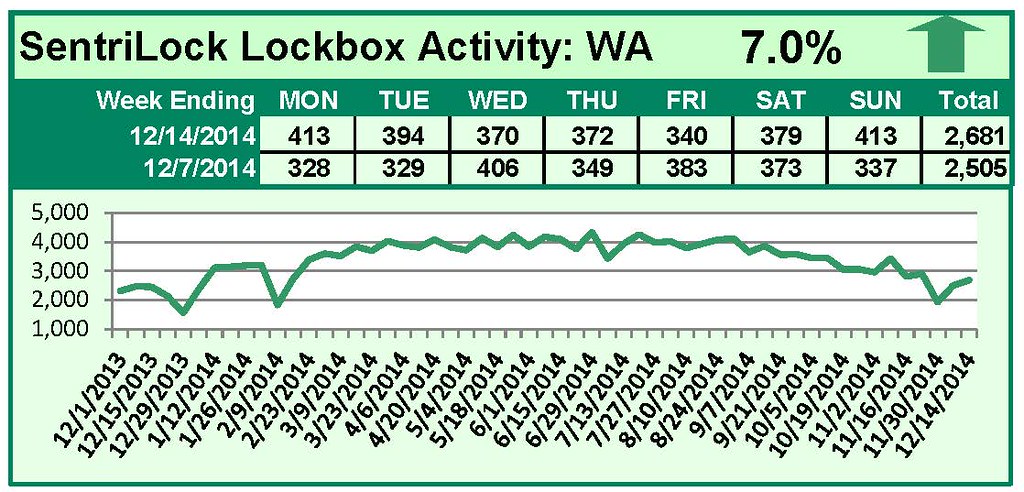
For the week of December 8-14, 2014, these charts show the number of times RMLS™ subscribers opened SentriLock lockboxes in Oregon and Washington. Washington saw an increase in activity this week, while activity in Oregon decreased.

For a larger version of each chart, visit the RMLS™ photostream on Flickr.


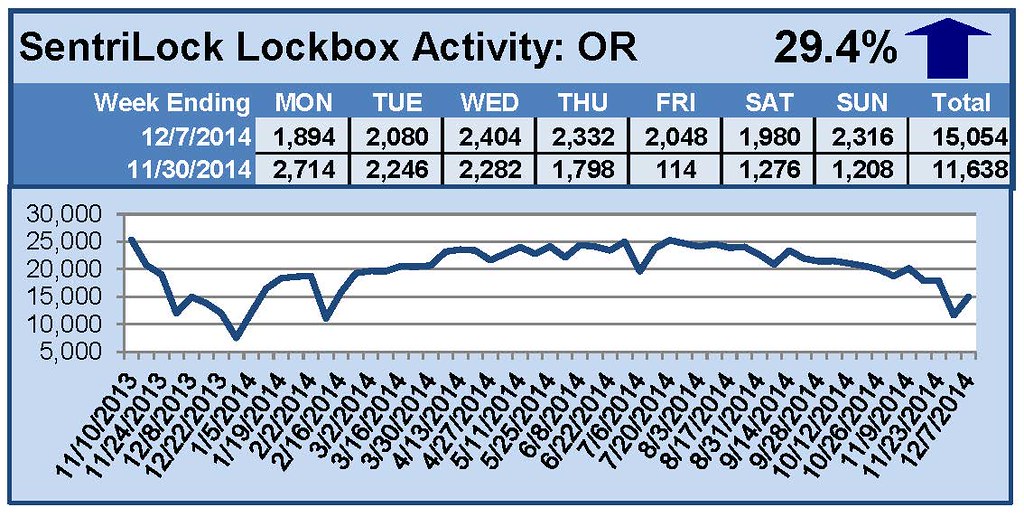
SentriLock Lockbox Activity December 1-7, 2014

This Week’s Lockbox Activity

For the week of December 1-7, 2014, these charts show the number of times RMLS™ subscribers opened SentriLock lockboxes in Oregon and Washington. Showing activity rebounded in both states this week.

For a larger version of each chart, visit the RMLS™ photostream on Flickr.