Detail View is Expanding on RMLSweb

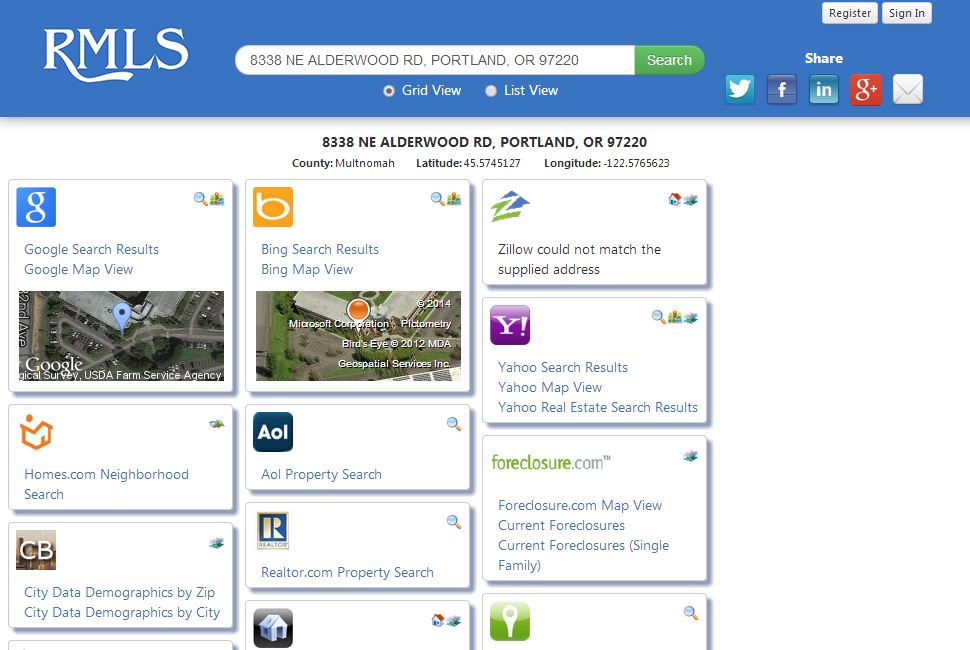
RMLS™ is adding a detail view tab to several searches on RMLSweb as part of the regular monthly outage scheduled for Wednesday, April 30th. Detail view provides a list of properties on the left and a window showing selected reports on the right. (In the sample below, the Agent Full report is shown.) Users can select tabs to navigate through the various available reports.

DetailView

Listing Load got the detail view treatment last summer, and this spring we’ll be expanding the feature to the following areas:
• Map Search
• Quick Search
• Advanced Search
• Street(s)/Address Search
• MLS Number Search
• Actual Expireds Search
• Radius Search

The RMLS™ development staff expanded the use of detail view on RMLSweb as it offered an answer to some common problems. Users will be able to switch between reports without reloading the whole page. Not only is this process faster than waiting for each to reload when browsing listings, but the user won’t lose their place in a long search results list after reading details in each listing.

RMLSweb will remember which view the user used last. This means that if you find yourself using detail view more than list view, you won’t need to toggle to your preferred setting each time you run a search!

Detail view makes browsing easier for users, but doesn’t have the same capabilities as list view. To print search results, you will need to use the list view tab. Also, detail view doesn’t support printing reports directly—if you want to print a report from detail view, you’ll still need to navigate to the report using the report menu (upper right hand of the screen) and then use the print button. And if you have custom columns set up, you’ll only be able to use them in list view.

This is the first rollout in this year’s search improvement project—one of the main projects RMLS™ will be implementing this year. (More on the RMLS™ development process here.)

We hope you find detail view to be helpful as you’re browsing properties for clients. Keep watch on RMLS™ this year, as we have more improvements in the works!


SentriLock Lockbox Activity April 7-13, 2014

This Week’s Lockbox Activity

For the week of April 7-13, 2014, these charts show the number of times RMLS™ subscribers opened SentriLock lockboxes in Oregon and Washington. Activity fell in both Oregon and Washington this week.

For a larger version of each chart, visit the RMLS™ photostream on Flickr.

Please note: due to the RMLS™ transition to SentriLock, historical data is only currently available through the RMLS™ Flickr page, under the tag “Supra lockbox activity.” SentriLock data will continue accumulating until each chart represents a year of data.


Residential Distressed Properties for First Quarter (January-March) 2014

AllAreas1QDistressed

This chart shows the number of bank owned/REO properties and short sales in all areas of the RMLS™ system during the first quarter of 2014.

Below are links to additional charts for some of our larger areas.
Portland Metro Distressed Properties (1st Quarter 2014)
Clark County, WA Distressed Properties (1st Quarter 2014)
Lane County, OR Distressed Properties (1st Quarter 2014)
Douglas County, OR Distressed Properties (1st Quarter 2014)
Coos County, OR Distressed Properties (1st Quarter 2014)

Here are some additional facts about distressed residential properties in the first quarter of 2014:

All areas when comparing percentage share of the market, first quarter 2014 to fourth quarter 2013:
• When comparing the first quarter 2014 to fourth quarter 2013, distressed sales as a percentage of new listings decreased by 2.4% (10.1 v. 12.5%).
• In a comparison of the first quarter 2014 to fourth quarter 2013, distressed sales as a percentage of closed sales increased by 1.5% (13.6 v. 12.1%).
• Short sales comprised 4.4% of new listings and 6.3% of sales in the first quarter of 2014, down 1.6% and 0.5% from the fourth quarter of 2013, respectively.
• Bank owned/REO properties comprised 5.7% of new listings and 7.3% of sales in the first quarter of 2014, down 0.8% and up 2.0% from the fourth quarter of 2013, respectively.

Portland metro when comparing percentage share of the market, first quarter 2014 to fourth quarter 2013:
• When comparing the first quarter 2014 to fourth quarter 2013, distressed sales as a percentage of new listings decreased by 1.7% (8.9 v. 10.6%).
• In a comparison of first quarter 2014 to fourth quarter 2013, distressed sales as a percentage of closed sales increased by 0.2% (11.0 v. 10.8%).
• Short sales comprised 4.3% of new listings and 6.1% of sales in the first quarter of 2014, down 1.7% and 1.1% from the fourth quarter of 2013, respectively.
• Bank owned/REO properties comprised 4.6% of new listings and 4.9% of sales in the first quarter of 2014, even with and up 1.3% from the fourth quarter of 2013, respectively.

Clark County when comparing percentage share of the market, first quarter 2014 to fourth quarter 2013:
• When comparing the first quarter 2014 to fourth quarter 2013, distressed sales as a percentage of new listings decreased by 6.1% (12.5 v. 18.6%).
• In a comparison of first quarter 2014 to fourth quarter 2013, distressed sales as a percentage of closed sales increased by 5.5% (23.1 vs. 17.6%).
• Short sales comprised 5.9% of new listings and 10.9% of sales in the first quarter of 2014, up 2.3% for new listings and 1.8% for sales when compared to the fourth quarter of 2013, respectively.
• Bank owned/REO properties comprised 6.6% of new listings and 12.2% of sales in the first quarter of 2014, down 3.8% and up 3.7% from the fourth quarter of 2013, respectively.

If you’d like more information or percentages of distressed residential sales in other areas not represented by our charts, please contact us at communications@rmls.com.


SentriLock Lockbox Activity March 31-April 6, 2014

This Week’s Lockbox Activity

For the week of March 31-April 6, 2014, these charts show the number of times RMLS™ subscribers opened SentriLock lockboxes in Oregon and Washington. Showings rose in Oregon, but fell in Washington this week.

For a larger version of each chart, visit the RMLS™ photostream on Flickr.

Please note: due to the RMLS™ transition to SentriLock, historical data is only currently available through the RMLS™ Flickr page, under the tag “Supra lockbox activity.” SentriLock data will continue accumulating until each chart represents a year of data.


April is Fair Housing Month: Resources to Explore

FairHousingCollage

Fair Housing Month commemorates the anniversary of the Fair Housing Act in 1968. This major legislation sought to put an end to housing discrimination of all kinds—although many believe discrimination has only become more subtle in the decades since that time.

The Fair Housing Council of Oregon commemorates Fair Housing Month by organizing community events (Here is FHCO’s list of Fair Housing Month Events for 2014). They also offer historical tours of Portland, with important stops that serve to illustrate why fair housing is important to our past, present and future. These tours are highly recommended by RMLS™ staff, including Data Accuracy Liaison Vallerie Bush, who thinks REALTORS® who want to learn more about the history of Portland, or REALTORS® new to the area might find the tour especially enlightening.

The National Association of REALTORS® observes Fair Housing Month each year to “recognize the significance of [the Fair Housing Act of 1968] and reconfirm our commitment to offering equal professional service to all.” Click the link and find a set of articles including “Four Things You Didn’t Know About the Fair Housing Act,” and “What Everyone Should Know About Equal Opportunity Housing.”

An episode of This American Life called “House Rules” aired last year, which illustrated the ongoing need for fair housing laws. National Public Radio followed up with “A Battle for Fair Housing Still Raging, But Mostly Forgotten,” an interview with reporter Nikole Hannah-Jones, who became interested in the topic while reporting on the topic in our very own Portland, Oregon.

While Hannah-Jones worked for The Oregonian, the paper ran an extended series about housing discrimination in Portland in Locked Out. The series begins with “Portland Housing Audit Finds Discrimination in 64% of Tests; City Has Yet to Act Against Landlords” in May 2011. (That’s right—2011!)

We hope you’ll take some time to explore some of these resources and reflect on what you can do to help end discrimination and the fair housing movement through your work with clients.


SentriLock Lockbox Activity March 24-30, 2014

This Week’s Lockbox Activity

For the week of March 24-30, 2014, these charts show the number of times RMLS™ subscribers opened SentriLock lockboxes in Oregon and Washington. Showings in both Oregon and Washington rose this week.

For a larger version of each chart, visit the RMLS™ photostream on Flickr.

Please note: due to the RMLS™ transition to SentriLock, historical data is only currently available through the RMLS™ Flickr page, under the tag “Supra lockbox activity.” SentriLock data will continue accumulating until each chart represents a year of data.


SentriLock Lockbox Activity March 17-23, 2014

This Week’s Lockbox Activity

For the week of March 17-23, 2014, these charts show the number of times RMLS™ subscribers opened SentriLock lockboxes in Oregon and Washington. Showing activity fell in Washington and increased slightly in Oregon this week.

For a larger version of each chart, visit the RMLS™ photostream on Flickr.

Please note: due to the RMLS™ transition to SentriLock, historical data is only currently available through the RMLS™ Flickr page, under the tag “Supra lockbox activity.” SentriLock data will continue accumulating until each chart represents a year of data.


It’s Raining $avings in April: Initiation Fees Reduced by Up to 90%

AprilInitiationFee2014

Office initiation fees have been reduced to $50 in April!

This is a great opportunity for offices to join RMLS™ and experience the benefits of sharing with more than 10,000 REALTORS® accessing your client’s listings.

Main Office Initiation Fee: $50 (regularly $500)
Branch Office Initiation Fee: $50 (regularly $100)
Affiliate Office Initiation Fee: $50 (regularly $400)

For more information on this promotion, email our Accounting Department, call them at (503) 872-8003, or stop by your nearest RMLS™ office.

ONLY Available April 2014!


Search for Data to Shout About with ShackShout!

Need to know what information is available on the internet regarding a particular property? A traditional web search can return irrelevant or outdated information. Finding, sorting, and understanding data that’s relevant can be difficult for a REALTOR® to do. (Doing so faster than a client is even more difficult!)

Enter ShackShout, now available on RMLSweb.

ShackShoutButtonA ShackShout button is now available at the bottom of each Agent Full listing on RMLSweb. Clicking the link will take you to an aggregated list of information pertaining to the listing.

ShackShout provides instant links to property, neighborhood, and geographic data, including:
• Walk Score
• Great Schools
• Cell Signal Maps
• and more!
Providing this information in one quickly accessible place gives RMLS™ members the tools to stay a step ahead of clients.

ShackShoutPropertyShackShout can assist REALTORS® with listing presentations, branding, reporting, and marketing. Try ShackShout on a listing today, and experience how fast and easy it can be to find information in a single location! We’re certain you’ll find something to shout about.


SentriLock Lockbox Activity March 10-16, 2014

This Week’s Lockbox Activity

For the week of March 10-16, 2014, these charts show the number of times RMLS™ subscribers opened SentriLock lockboxes in Oregon and Washington. Showing activity increased in both Washington and Oregon this week.

For a larger version of each chart, visit the RMLS™ photostream on Flickr.

Please note: due to the RMLS™ transition to SentriLock, historical data is only currently available through the RMLS™ Flickr page, under the tag “Supra lockbox activity.” SentriLock data will continue accumulating until each chart represents a year of data.