SentriLock Lockbox Activity January 6-12, 2014

This Week’s Lockbox Activity

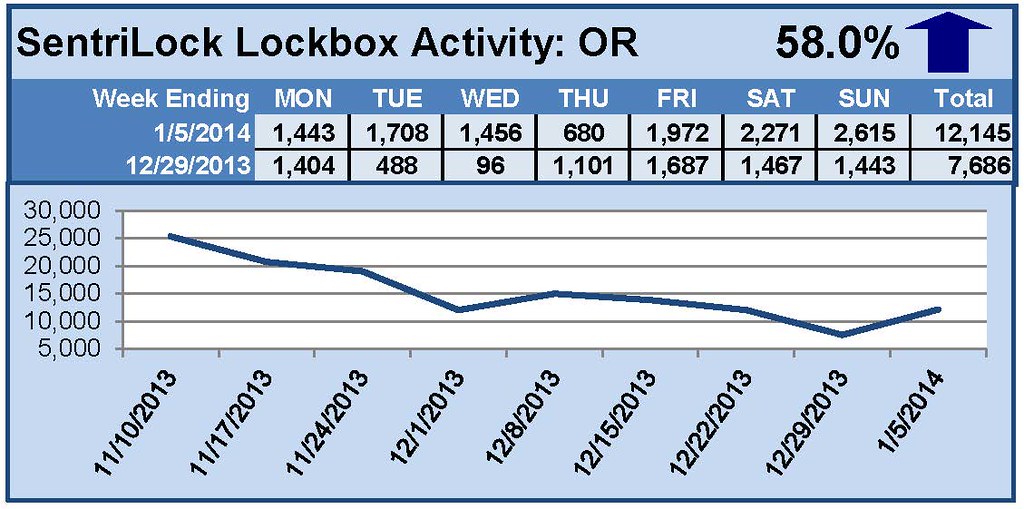
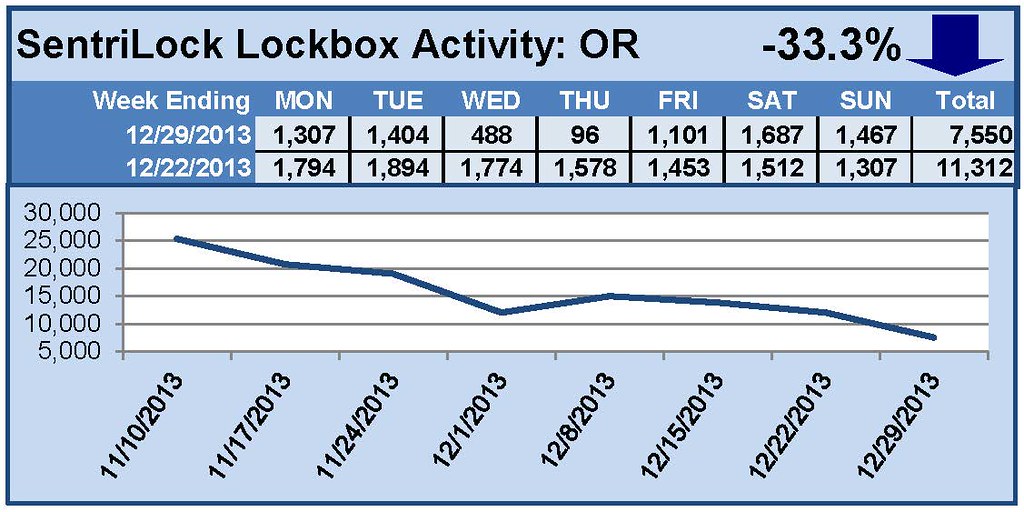
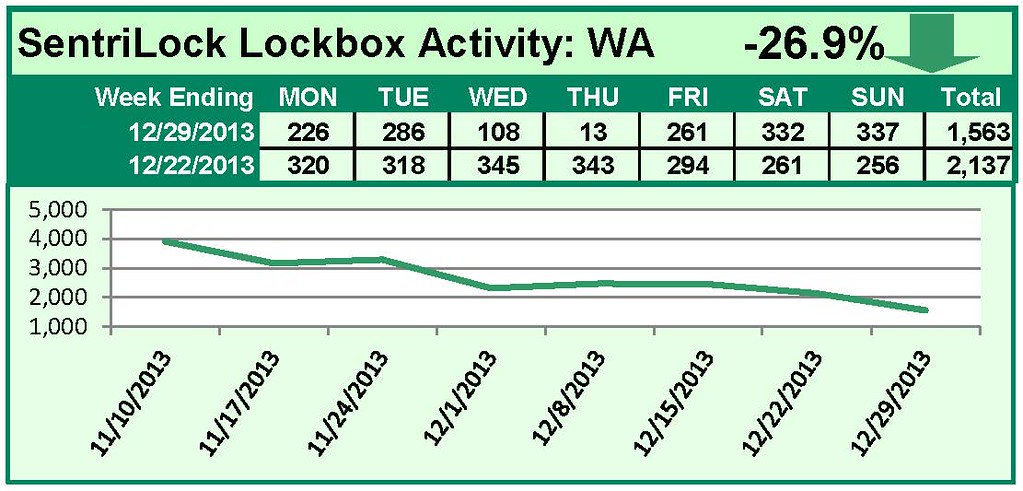
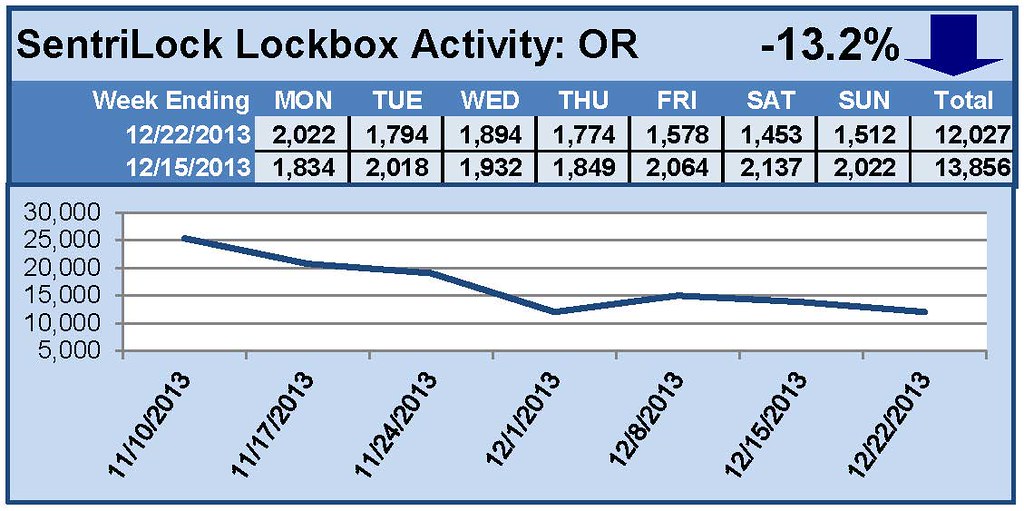
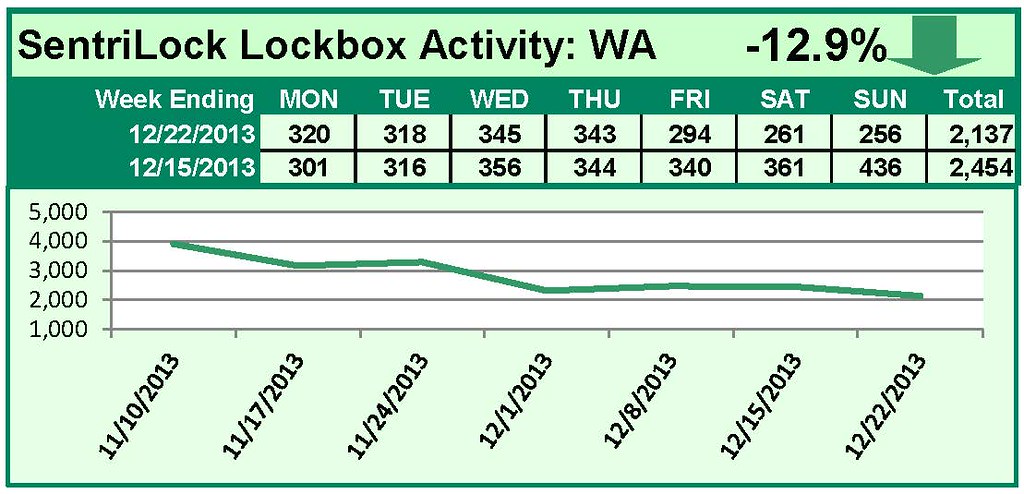
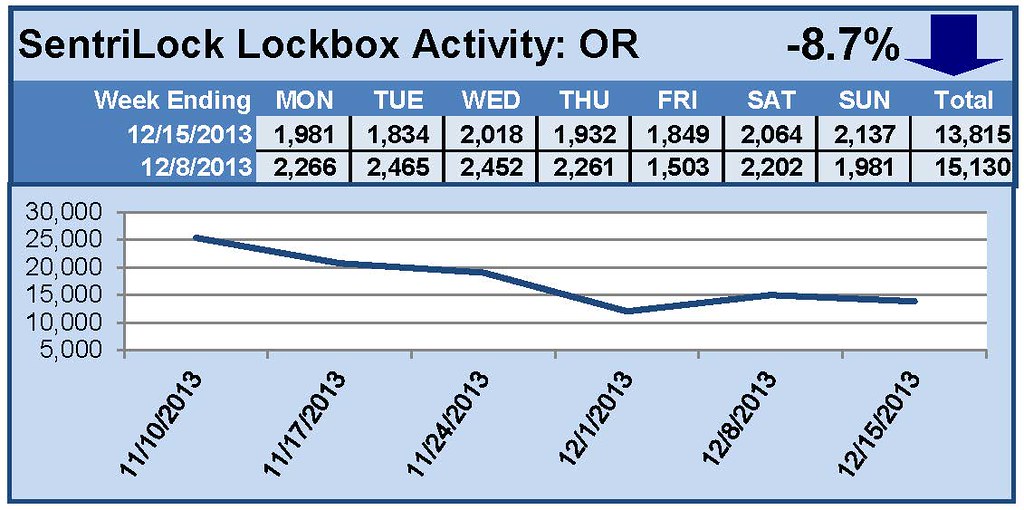
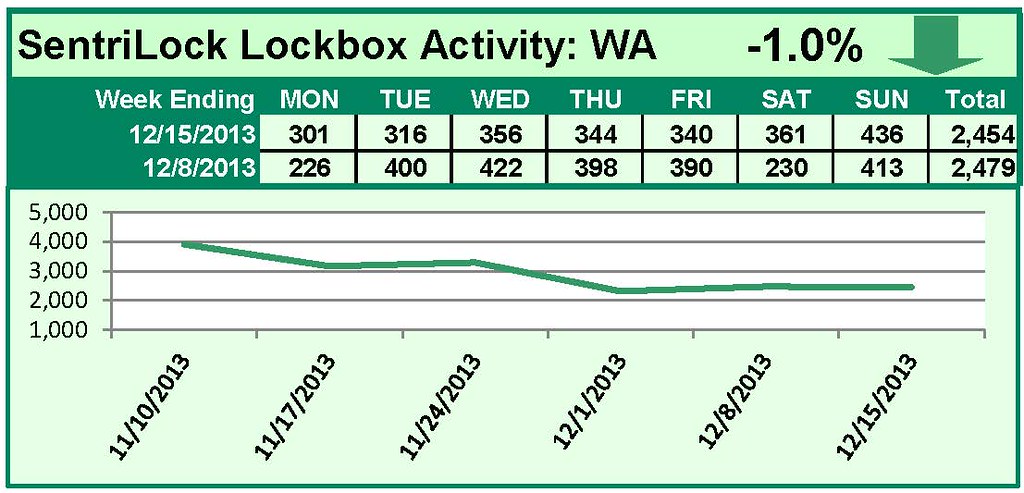
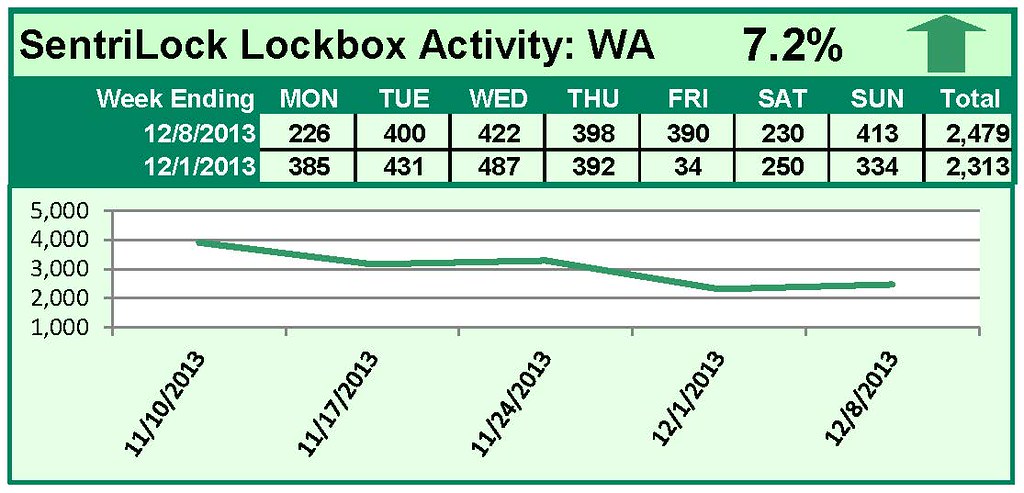
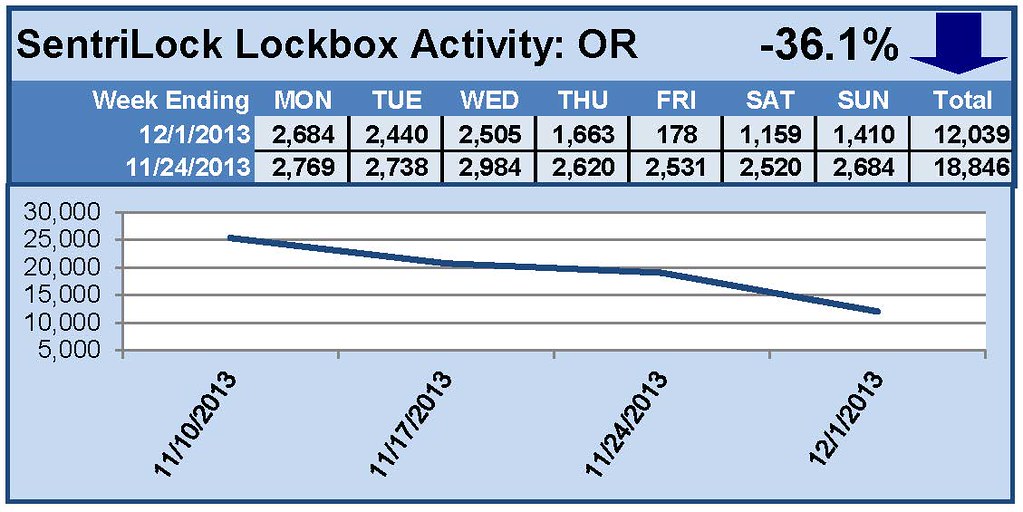
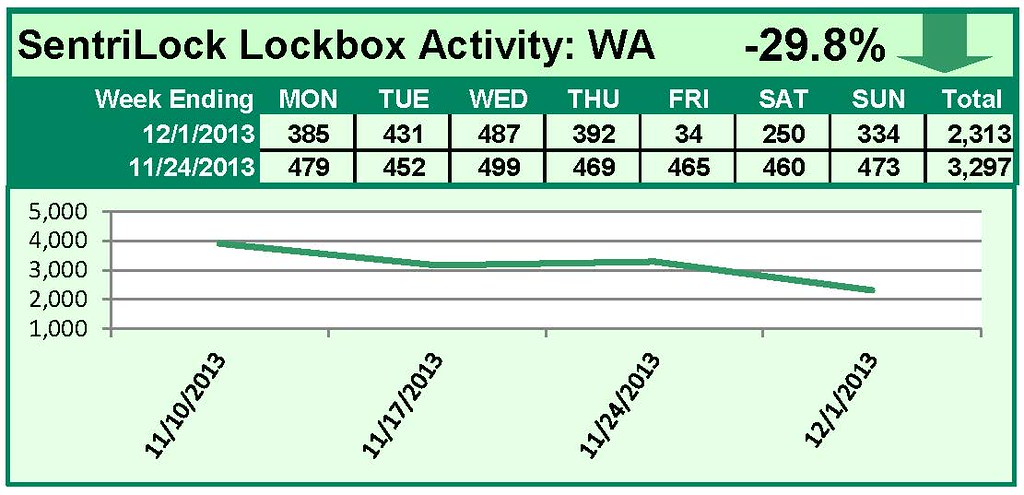
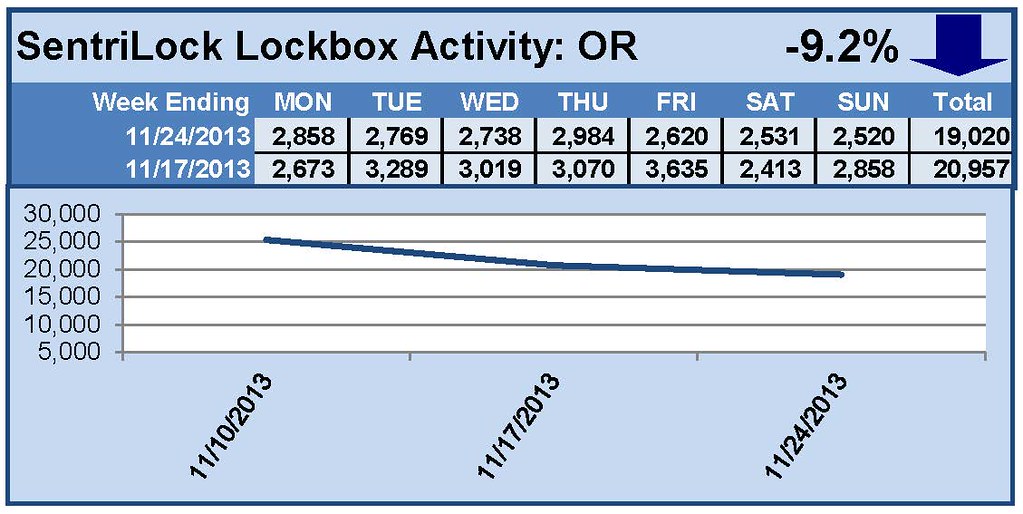
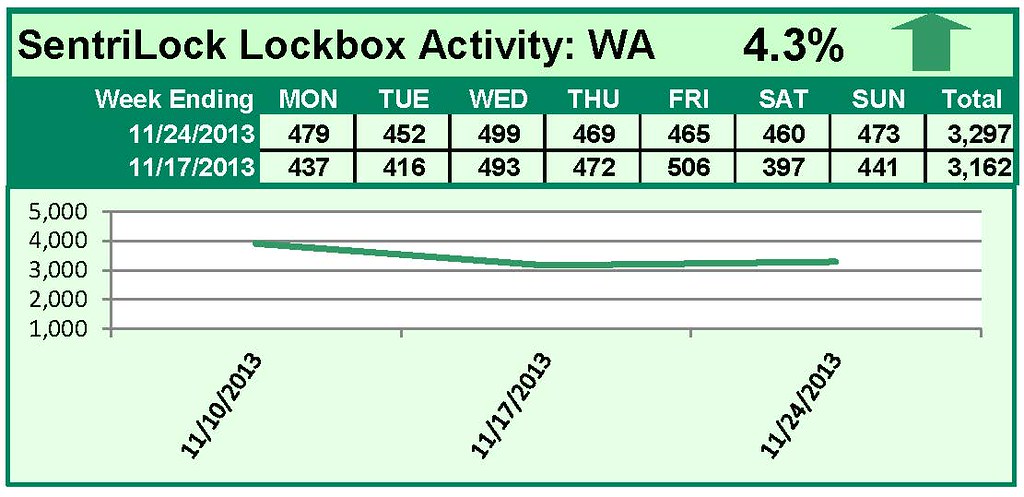
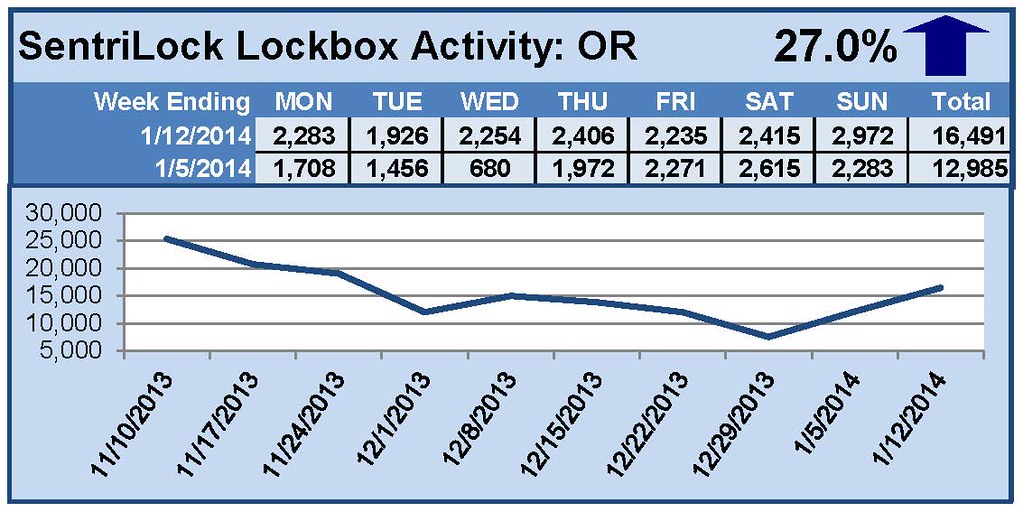
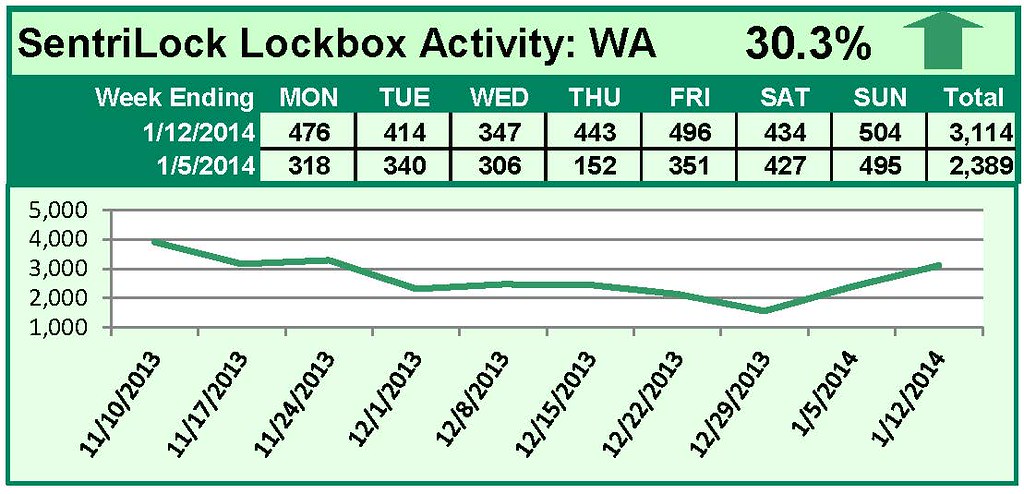
For the week of January 6-12, 2014, these charts show the number of times RMLS™ subscribers opened SentriLock lockboxes in Oregon and Washington. Showings rose significantly in both states this week.

For a larger version of each chart, visit the RMLS™ photostream on Flickr.

Please note: due to the RMLS™ transition to SentriLock, historical data is only currently available through the RMLS™ Flickr page, under the tag “Supra lockbox activity.” SentriLock data will continue accumulating until each chart represents a year of data.


SentriLock Lockbox Activity December 30, 2013-January 5, 2014

This Week’s Lockbox Activity

For the week of December 30, 2013-January 5, 2014, these charts show the number of times RMLS™ subscribers opened SentriLock lockboxes in Oregon and Washington. Showings increased significantly in both states this week.

For a larger version of each chart, visit the RMLS™ photostream on Flickr.

Please note: due to the RMLS™ transition to SentriLock, historical data is only currently available through the RMLS™ Flickr page, under the tag “Supra lockbox activity.” SentriLock data will continue accumulating until each chart represents a year of data.


Save the Date! RMLS™ Education Summit and Trade Fair Coming March 13, 2014

RMLS Trade Fair


SentriLock Lockbox Activity December 23-29, 2013

This Week’s Lockbox Activity

For the week of December 23-29, 2013, these charts show the number of times RMLS™ subscribers opened SentriLock lockboxes in Oregon and Washington. Showing activity fell in both Oregon and Washington this week.

For a larger version of each chart, visit the RMLS™ photostream on Flickr.

Please note: due to the RMLS™ transition to SentriLock, historical data is only currently available through the RMLS™ Flickr page, under the tag “Supra lockbox activity.” SentriLock data will continue accumulating until each chart represents a year of data.


SentriLock Lockbox Activity December 16-22, 2013

This Week’s Lockbox Activity

For the week of December 16-22, 2013, these charts show the number of times RMLS™ subscribers opened SentriLock lockboxes in Oregon and Washington. Activity fell in both Oregon and Washington this week.

For a larger version of each chart, visit the RMLS™ photostream on Flickr.

Please note: due to the RMLS™ transition to SentriLock, historical data is only currently available through the RMLS™ Flickr page, under the tag “Supra lockbox activity.” SentriLock data will continue accumulating until each chart represents a year of data.


SentriLock Lockbox Activity December 9-15, 2013

This Week’s Lockbox Activity

For the week of December 9-15, 2013, these charts show the number of times RMLS™ subscribers opened SentriLock lockboxes in Oregon and Washington. Oregon and Washington both saw decreases in showings this week.

For a larger version of each chart, visit the RMLS™ photostream on Flickr.

Please note: due to the RMLS™ transition to SentriLock, historical data is only currently available through the RMLS™ Flickr page, under the tag “Supra lockbox activity.” SentriLock data will continue accumulating until each chart represents a year of data.


SentriLock Lockbox Activity December 2-8, 2013

This Week’s Lockbox Activity

For the week of December 2-8, 2013, these charts show the number of times RMLS™ subscribers opened SentriLock lockboxes in Oregon and Washington. Showings rose in both Oregon and Washington this week.

For a larger version of each chart, visit the RMLS™ photostream on Flickr.

Please note: due to the RMLS™ transition to SentriLock, historical data is only currently available through the RMLS™ Flickr page, under the tag “Supra lockbox activity.” SentriLock data will continue accumulating until each chart represents a year of data.


Bonus Improvement in December: Drawing Map Shapes on Tablets

RMLS™ rolled out updates earlier this week on RMLSweb to improve the site’s performance on tablet computers. In addition to the features we knew would be going live, we were able to work with our map vendor to squeeze in another improvement: the ability to draw map shapes on a tablet!

How do you do it? We prepared a short video demonstration (view at full screen to see important details):

A key to successful map shapes on your tablet is clicking to close the shape, using the button at the top of the map search interface.

(We’re using our RMLS™ pen to navigate, which is designed to convert easily between a ballpoint pen and a stylish stylus. Stop by your local RMLS™ office for one of your own!)

Let us know how this feature is working for you! RMLS™ has been excited for the release of these improvements and hope they make your job easier in the coming months. As usual, call the RMLS™ Help Desk if we can help: (503) 872-8002 or (877) 256-2169 toll free.


SentriLock Lockbox Activity November 25-December 1, 2013

This Week’s Lockbox Activity

For the week of November 25-December 1, 2013, these charts show the number of times RMLS™ subscribers opened SentriLock lockboxes in Oregon and Washington. Showings decreased sharply in both Oregon and Washington this week.

For a larger version of each chart, visit the RMLS™ photostream on Flickr.

Please note: due to the RMLS™ transition to SentriLock, historical data is only currently available through the RMLS™ Flickr page, under the tag “Supra lockbox activity.” SentriLock data will continue accumulating until each chart represents a year of data.


SentriLock Lockbox Activity November 18-24, 2013

This Week’s Lockbox Activity

For the week of November 18-24, 2013, these charts show the number of times RMLS™ subscribers opened SentriLock lockboxes in Oregon and Washington. Showings increased in Washington but decreased in Oregon this week.

For a larger version of each chart, visit the RMLS™ photostream on Flickr.

Please note: due to the RMLS™ transition to SentriLock, historical data is only currently available through the RMLS™ Flickr page, under the tag “Supra lockbox activity.” SentriLock data will continue accumulating until each chart represents a year of data.