Fair Housing Laws Protect Us All

Fair housing is not just about “them”; we all belong to one or more protected class

By Jo Becker, Education/Outreach Specialist, Fair Housing Council of Oregon

This is the last in a series of blogs about April being the federal Fair Housing Month. Fair housing laws apply to all housing transactions—sales, mortgage lending, home insurance, HOA’s, rentals and neighbor-on-neighbor harassment. The law even applies to student housing, designated senior housing, assisted living facilities and nursing homes as well as adult foster care homes and shelters, etc.

We often think of fair housing in terms of “them.” But to be clear, we all belong to one or more protected class. Each of us has a sex, a race and a religion (or not). We all have the right to choose where we live and to enjoy our housing without regard to protected class status. The bottom line is that fair housing applies to everyone and running afoul of the law not only harms individuals, families and society, but it can also be a costly mistake.

Because discrimination continues and there is still a lack of working knowledge about fair housing laws by both housing consumers and providers, FHCO proactively provides information on the law, acts as a resource for questions about fair housing and responds to complaints of illegal housing discrimination throughout Oregon and SW Washington. Despite our efforts, one out of every ten Oregonians believes he or she has been a victim of illegal housing discrimination.

Please be proactive and ensure that you understand your rights and responsibilities under the law! Please make an attempt to learn about fair housing and also visit the Breaking News section of our entry page at www.FHCO.org to read about national and local cases surrounding these related issues.

Are you interested in attending a fair housing class (good for core credits!)?
We post upcoming classes on our entry page under the heading of Events and Classes.

Are you interested in having an in-house presentation or class for your office, company or organization? You can find our current class list along with pricing information at: www.FHCO.org/pdfs/classlist.pdf.
—–
This article brought to you by the Fair Housing Council; a nonprofit serving the state of Oregon and SW Washington. Learn more and/or sign up for our free, periodic newsletter at www.FHCO.org.

Qs about your rights and responsibilities under fair housing laws?
Visit www.FHCO.org or call 1-800-424-3247 Ext. 2.

Qs about this article? Do you want to schedule an in-office fair housing training program or speaker for corporate or association functions?
Contact Jo Becker at jbecker@FHCO.org or 503-453-4016.

Have property to promote?
Advertise vacancies or for-sales free across the Portland/Vancouver market at: www.HousingConnections.org
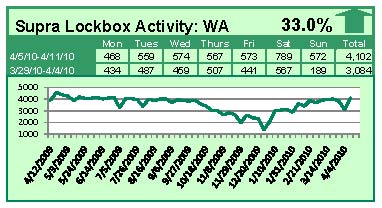
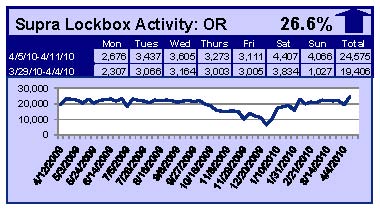


Supra Lockbox Activity – Updated Through April 11

Lockbox opens rebound, graphs get new look

When comparing the week of April 5 – April 11 with the week prior, the number of times an RMLS™ subscriber opened a Supra lockbox increased 33% in Washington and 26.6% in Oregon.


Click the chart for a larger view

Archive
View an archive of the Supra lockbox statistical reports on Flickr.


Supra Lockbox Activity – Updated Through Week of March 1-7

Increases noted in Washington and Oregon

When comparing the week of March 1-7 with the week prior, the number of times an RMLS™ subscriber opened a Supra lockbox increased 5.6% in Washington and 7.6% in Oregon.


Click the chart for a larger view

Archive
View an archive of the Supra lockbox statistical reports on Flickr.


Supra Lockbox Activity – Updated Through Week of Feb. 22-28

Declines noted for Washington and Oregon

When comparing the week of February 22-28 with the week prior, the number of times an RMLS™ subscriber opened a Supra lockbox decreased 4.9% in Washington and 1.7% in Oregon.


Click the chart for a larger view


March Real Estate Events & Education

Spring into action this March with free RMLSweb training

Here’s a quick rundown of upcoming real estate events & education for March in Oregon & Southern Washington. If you have an event that is not listed here, please let us know by commenting below. For future events, please send an e-mail to communications (at) rmls (dot) com.

Save the Date:

-April 1: RMLS™ hosts the 2010 RMLS™ Trade Fair at the Oregon Convention Center, 10 a.m. to 4 p.m.

Events around the Region:

-March 4: The Eugene Association of Realtors® offers “I Have My License, Now What?” course

-March 6 & 7: Home Builders Association of Metropolitan Portland hosts Tour of Remodeled Homes

-March 11: Women’s Council of Realtors® – Portland Chapter hosts Business Resource Breakfast: Referrals & Networking

-March 11: PMAR® –Recognizing Fraud in Today’s Marketplace educational event

-March 17: PMAR ® hosts Navigating the Realtor® Code of Ethics training seminar

-March 25: Clark County Association of Realtors®  hosts RPAC Dessert Auction at The Heathman Lodge

Also, if you’re an RMLS™ subscriber, we have lots of FREE opportunities for continuing education credit at a location near you; click the link for your area to view the March Training Calendar:

– Coos County
Eastern Oregon
– Eugene
Florence
– Gresham
– Hood River
– Portland
– Roseburg
– Salem
– Vancouver


Extreme RMLSweb Makeover: Statistics

New statistics menu makes spotting market trends easier

You may have noticed that the Statistical Reports in RMLSweb recently got a facelift and moved to a new location on the NavBar. But what does this mean for your business? Here are three ways that you can use these new reports to answer real world questions:

Price Reductions – You just got a new listing and you’re excited, but you’re discovering that the seller’s expectations of how much the property will sell for are a little unrealistic and you’re not sure how to talk them down. Their neighbor sold theAverage Median Price by Monthir house for $385,000 this time last year and it’s only a 3 bedroom, 2 bath. Because your sellers have a 3 bedroom, 3 bathroom house they’re convinced that it should sell for at least $400,000, but you know the market has changed in a year and homes aren’t selling for as much as they were back then. Unfortunately, they’re not taking your word for it. Try running a Market Trends report for 12 months back in that MLS area, which will provide you with charts and data about how the average price has changed during the last year.

Foreclosures & Short Sales – With the changing economy, the question on everyone’s mind these days is, “How do short sales and foreclosures perform in today’s market?” With Advanced Search you can search by Bank Owned Yes to find out how many foreclosures sold last year in your market or Short Sale Yes to find out how many active listings in your area are short sales. Be sure to check Show Summary on the Search Results page and then scroll to the bottom of the page to get some additional statistics about your results, such as CDOM (for SLD statuses only), Average Price and Average SQFT.

Understanding FAverage Median Price by Sold Termsinancing Trends Through your conversations with buyers you get the sense that the types of financing they are using today seems to be changing, but you’re looking for some data to back up your hunch. Look no further, because running our Market Stats Comparable Summary report can tell you this information.

We would love to hear how you utilize these tools in your day-to-day business. Feel free to leave a comment below. To schedule a training session on this new release, call your local RMLS™ office, or e-mail training@rmls.com.


Supra Lockbox Activity – Updated Through Week of Feb. 8-14

Back up from previous week

When comparing the week of February 8-14 with the week prior, the number of times an RMLS™ subscriber opened a Supra lockbox increased 9.9% in Washington and 3.2% in Oregon.


Click the chart for a larger view

Archive
View an archive of the Supra lockbox statistical reports on Flickr.


RMLS Market Action – January 2010 Recap

January 2010 outperforms January 2009, but inventory still climbs

Despite the fact that closed and pending sales were up significantly when comparing January 2010 to January 2009 in most of our Market Action service areas, inventory also climbed significantly compared to the previous month. This is most likely due to the fact that new listings increased and closed sales decreased in most areas when comparing January 2010 with December 2009.

Portland saw a 34.7% increase in closed sales this month and a 24.3% increase in pending listings, while Clark County closed sales were up 34.8%, and pending sales rose 20.2%. Coos County, Douglas County, Lane County, the Mid-Columbia region and Union County also saw both closed and pending sales increase over last December.

Inventory Increase
Inventory jumped significantly in all areas in January 2010. In many of the areas this may be due to lower sales totals and higher numbers of new listings when compared to last. Portland increased from 7.7 months to 12.6 months. Clark County also entered the double digits, going from 7.6 months to 12.4. In addition, Lane County went from 7.1 months to 14.1 months. Keep in mind that this is pretty typically behavior in January.

Price Change
Average and Median sale prices continue to decline when compared to last year, in Portland, 5% and 4% respectively. But in Clark County prices are actually rose, 4.2% and 5.5% respectively. In addition, Clark County average and median sales prices increased when compared to December 2009, 0.3% and 3.9% respectively