Residential Distressed Properties for Second Quarter (April-June) 2014

AllAreas2QDistressed

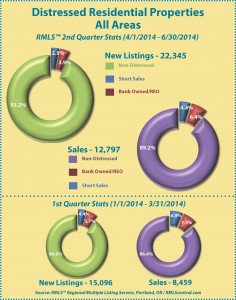
This chart shows the number of bank owned/REO properties and short sales in all areas of the RMLS™ system during the second quarter of 2014.

Below are links to additional charts for some of our larger areas.
Portland Metro Distressed Properties (2nd Quarter 2014)
Clark County, WA Distressed Properties (2nd Quarter 2014)
Lane County, OR Distressed Properties (2nd Quarter 2014)
Douglas County, OR Distressed Properties (2nd Quarter 2014)
Coos County, OR Distressed Properties (2nd Quarter 2014)

Here are some additional facts about distressed residential properties in the second quarter of 2014:

All areas when comparing percentage share of the market, second quarter 2014 to first quarter 2014:
• When comparing the second quarter 2014 to first quarter 2014, distressed sales as a percentage of new listings decreased by 3.3% (6.8 v. 10.1%).
• In a comparison of the second quarter 2014 to first quarter 2014, distressed sales as a percentage of closed sales decreased by 2.8% (10.8 v. 13.6%).
• Short sales comprised 2.9% of new listings and 4.4% of sales in the second quarter of 2014, down 1.5% and 1.9% from the first quarter of 2014, respectively.
• Bank owned/REO properties comprised 3.9% of new listings and 6.4% of sales in the second quarter of 2014, down 1.8% and 0.9% from the first quarter of 2014, respectively.

Portland metro when comparing percentage share of the market, second quarter 2014 to first quarter 2014:
• When comparing the second quarter 2014 to first quarter 2014, distressed sales as a percentage of new listings decreased by 2.8% (6.1 v. 8.9%).
• In a comparison of second quarter 2014 to first quarter 2014, distressed sales as a percentage of closed sales decreased by 2.2% (8.8 v. 11.0%).
• Short sales comprised 3.0% of new listings and 4.1% of sales in the second quarter of 2014, down 1.3% and 2.0% from the first quarter of 2014, respectively.
• Bank owned/REO properties comprised 3.1% of new listings and 4.7% of sales in the second quarter of 2014, down 1.5% and 0.2% from the first quarter of 2014, respectively.

Clark County when comparing percentage share of the market, second quarter 2014 to first quarter 2014:
• When comparing the second quarter 2014 to first quarter 2014, distressed sales as a percentage of new listings decreased by 3.1% (9.4 v. 12.5%).
• In a comparison of second quarter 2014 to first quarter 2014, distressed sales as a percentage of closed sales decreased by 7.3% (15.8 v. 23.1%).
• Short sales comprised 4.7% of new listings and 6.7% of sales in the second quarter of 2014, down 1.2% for new listings and 4.2% for sales when compared to the first quarter of 2014, respectively.
• Bank owned/REO properties comprised 4.7% of new listings and 9.1% of sales in the second quarter of 2014, down 1.9% and 3.1% from the first quarter of 2014, respectively.

If you’d like more information or percentages of distressed residential sales in other areas not represented by our charts, please contact us at communications@rmls.com.

Residential Distressed Properties for First Quarter (January-March) 2014

AllAreas1QDistressed

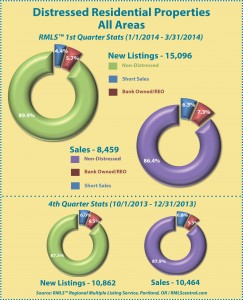
This chart shows the number of bank owned/REO properties and short sales in all areas of the RMLS™ system during the first quarter of 2014.

Below are links to additional charts for some of our larger areas.
Portland Metro Distressed Properties (1st Quarter 2014)
Clark County, WA Distressed Properties (1st Quarter 2014)
Lane County, OR Distressed Properties (1st Quarter 2014)
Douglas County, OR Distressed Properties (1st Quarter 2014)
Coos County, OR Distressed Properties (1st Quarter 2014)

Here are some additional facts about distressed residential properties in the first quarter of 2014:

All areas when comparing percentage share of the market, first quarter 2014 to fourth quarter 2013:
• When comparing the first quarter 2014 to fourth quarter 2013, distressed sales as a percentage of new listings decreased by 2.4% (10.1 v. 12.5%).
• In a comparison of the first quarter 2014 to fourth quarter 2013, distressed sales as a percentage of closed sales increased by 1.5% (13.6 v. 12.1%).
• Short sales comprised 4.4% of new listings and 6.3% of sales in the first quarter of 2014, down 1.6% and 0.5% from the fourth quarter of 2013, respectively.
• Bank owned/REO properties comprised 5.7% of new listings and 7.3% of sales in the first quarter of 2014, down 0.8% and up 2.0% from the fourth quarter of 2013, respectively.

Portland metro when comparing percentage share of the market, first quarter 2014 to fourth quarter 2013:
• When comparing the first quarter 2014 to fourth quarter 2013, distressed sales as a percentage of new listings decreased by 1.7% (8.9 v. 10.6%).
• In a comparison of first quarter 2014 to fourth quarter 2013, distressed sales as a percentage of closed sales increased by 0.2% (11.0 v. 10.8%).
• Short sales comprised 4.3% of new listings and 6.1% of sales in the first quarter of 2014, down 1.7% and 1.1% from the fourth quarter of 2013, respectively.
• Bank owned/REO properties comprised 4.6% of new listings and 4.9% of sales in the first quarter of 2014, even with and up 1.3% from the fourth quarter of 2013, respectively.

Clark County when comparing percentage share of the market, first quarter 2014 to fourth quarter 2013:
• When comparing the first quarter 2014 to fourth quarter 2013, distressed sales as a percentage of new listings decreased by 6.1% (12.5 v. 18.6%).
• In a comparison of first quarter 2014 to fourth quarter 2013, distressed sales as a percentage of closed sales increased by 5.5% (23.1 vs. 17.6%).
• Short sales comprised 5.9% of new listings and 10.9% of sales in the first quarter of 2014, up 2.3% for new listings and 1.8% for sales when compared to the fourth quarter of 2013, respectively.
• Bank owned/REO properties comprised 6.6% of new listings and 12.2% of sales in the first quarter of 2014, down 3.8% and up 3.7% from the fourth quarter of 2013, respectively.

If you’d like more information or percentages of distressed residential sales in other areas not represented by our charts, please contact us at communications@rmls.com.


Residential Distressed Properties for Fourth Quarter (October-December) 2013

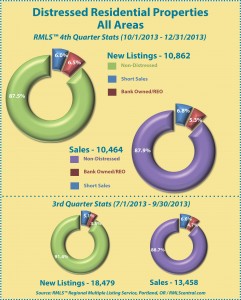
AllAreas4thQDistressedThis chart shows the number of bank owned/REO properties and short sales in all areas of the RMLS™ system during the fourth quarter of 2013.

Below are links to additional charts for some of our larger areas.
Portland Metro Distressed Properties (4th Quarter 2013)
Clark County, WA Distressed Properties (4th Quarter 2013)
Lane County, OR Distressed Properties (4th Quarter 2013)
Douglas County, OR Distressed Properties (4th Quarter 2013)
Coos County, OR Distressed Properties (4th Quarter 2013)

Here are some additional facts about distressed residential properties in the fourth quarter of 2013:

All areas when comparing percentage share of the market, fourth quarter 2013 to third quarter 2013:
• When comparing the fourth quarter 2013 to third quarter 2013, distressed sales as a percentage of new listings increased by 3.9% (12.5 v. 8.6%).
• In a comparison of the fourth quarter 2013 to third quarter 2013, distressed sales as a percentage of closed sales increased by 0.8% (12.1 v. 11.3%).
• Short sales comprised 6.0% of new listings and 6.8% of sales in the fourth quarter of 2013, up 0.9% and 0.2% from the third quarter of 2013, respectively.
• Bank owned/REO properties comprised 6.5% of new listings and 5.3% of sales in the fourth quarter of 2013, up 3.0% and 0.6% from the third quarter of 2013, respectively.

Portland Metro when comparing percentage share of the market, fourth quarter 2013 to third quarter 2013:
• When comparing the fourth quarter 2013 to third quarter 2013, distressed sales as a percentage of new listings increased by 3.1% (10.6% v. 7.5%).
• In a comparison of fourth quarter 2013 to third quarter 2013, distressed sales as a percentage of closed sales increased by 1.4% (10.8% v. 9.4%).
• Short sales comprised 6.0% of new listings and 7.2% of sales in the fourth quarter of 2013, up 0.7% and 0.9% from the third quarter of 2013, respectively.
• Bank owned/REO properties comprised 4.6% of new listings and 3.6% of sales in the fourth quarter of 2013, up 2.4% and 0.5% from the third quarter of 2013, respectively.

Clark County when comparing percentage share of the market, fourth quarter 2013 to third quarter 2013:
• When comparing the fourth quarter 2013 to third quarter 2013, distressed sales as a percentage of new listings increased by 4.7% (18.6% v. 13.9%).
• In a comparison of fourth quarter 2013 to third quarter 2013, distressed sales as a percentage of closed sales decreased by 1.9% (17.6% v. 19.5%).
• Short sales comprised 8.2% of new listings and 9.1% of sales in the fourth quarter of 2013, up 0.6% for new listings and down 2.0% for sales when compared to the third quarter of 2013, respectively.
• Bank owned/REO properties comprised 10.4% of new listings and 8.5% of sales in the fourth quarter of 2013, up 4.1% and up 0.1% from the third quarter of 2013, respectively.

If you’d like more information or percentages of distressed residential sales in other areas not represented by our charts, please contact us at communications@rmls.com.


Residential Distressed Properties for Third Quarter (July-September) 2013

AllAreas3rdQDistressed

This chart shows the number of bank owned/REO properties and short sales in all areas of the RMLS™ system during the third quarter of 2013.

Below are links to additional charts for some of our larger areas.
Portland Metro Distressed Properties (3rd Quarter 2013)
Clark County, WA Distressed Properties (3rd Quarter 2013)
Lane County, OR Distressed Properties (3rd Quarter 2013)
Douglas County, OR Distressed Properties (3rd Quarter 2013)
Coos County, OR Distressed Properties (3rd Quarter 2013)

Here are some additional facts about distressed residential properties in the third quarter of 2013:

All areas when comparing percentage share of the market, third quarter 2013 to second quarter 2013:
• When comparing the third quarter 2013 to second quarter 2013, distressed sales as a percentage of new listings decreased by .4% (8.6% v. 9.0%).
• In a comparison of the third quarter 2013 to second quarter 2013, distressed sales as a percentage of closed sales decreased by 4.0% (11.3% v. 15.3%).
• Short sales comprised 5.1% of new listings and 6.6% of sales in the third quarter of 2013, down .6% and 1.9% from the second quarter of 2013, respectively.
• Bank owned/REO properties comprised 3.5% of new listings and 4.7% of sales in the third quarter of 2013, up .2% and down 2.1% from the second quarter of 2013, respectively.

Portland Metro when comparing percentage share of the market, third quarter 2013 to second quarter 2013:
• When comparing the third quarter 2013 to second quarter 2013, distressed sales as a percentage of new listings decreased by .6% (7.5% v. 8.1%).
• In a comparison of third quarter 2013 to second quarter 2013, distressed sales as a percentage of closed sales decreased by 4.0% (9.4% v. 13.4%).
• Short sales comprised 5.3% of new listings and 6.3% of sales in the third quarter of 2013, down .5% and 2.1% from the second quarter of 2013, respectively.
• Bank owned/REO properties comprised 2.2% of new listings and 3.1% of sales in the third quarter of 2013, down .1% and 1.9% from the second quarter of 2013, respectively.

Clark County when comparing percentage share of the market, third quarter 2013 to second quarter 2013:
• When comparing the third quarter 2013 to second quarter 2013, distressed sales as a percentage of new listings decreased by 2.7% (13.9% v. 16.6%).
• In a comparison of third quarter 2013 to second quarter 2013, distressed sales as a percentage of closed sales decreased by 4.8% (19.5% v. 24.3%).
• Short sales comprised 7.6% of new listings and 11.1% of sales in the third quarter of 2013, down 2.1% for new listings and 2.5% for sales when compared to the second quarter of 2013, respectively.
• Bank owned/REO properties comprised 6.3% of new listings and 8.4% of sales in the third quarter of 2013, down .6% and 2.3% from the second quarter of 2013, respectively.

If you’d like more information or percentages of distressed residential sales in other areas not represented by our charts, please contact us at communications@rmls.com.


Housing Market Recovery by the Numbers

RMLSDollarVolbyYear
Click to enlarge

The RMLS™ Inventory Today chart on the desktop of RMLSweb showed that total sales volume for a twelve month period topped $12 billion on July 16th this year. The last time the sales volume was at that level was almost five years ago on September 8, 2008, with volume still on its way down to its low point reached in 2011.

While prices are currently increasing rapidly, they still have a way to go to reach their previous levels. The $12 billion volume in 2008 required only 39,456 sales at an average price of $304,443. The number of sales represented by the $12 billion this year was 46,901 with an average price of $255,942.

The housing market recovery has encompassed all of the RMLS™ market areas in Oregon and southern Washington to varying degrees, which the monthly Market Action reports demonstrate. Momentum is accelerating!


Residential Distressed Properties for Second Quarter (April-June) 2013

AllAreas2ndQDistressed

This chart shows the number of bank owned/REO properties and short sales in all areas of the RMLS™ system during the second quarter of 2013.

Below are links to additional charts for some of our larger areas.
Portland Metro Distressed Properties (2nd Quarter 2013)
Clark County, WA Distressed Properties (2nd Quarter 2013)
Lane County, OR Distressed Properties (2nd Quarter 2013)
Douglas County, OR Distressed Properties (2nd Quarter 2013)
Coos County, OR Distressed Properties (2nd Quarter 2013)

Here are some additional facts about distressed residential properties in the second quarter of 2013:

All areas when comparing percentage share of the market, second quarter 2013 to first quarter 2013:
• When comparing the second quarter 2013 to first quarter 2013, distressed sales as a percentage of new listings decreased by 6.3% (9.0% v. 15.3%).
• In a comparison of the second quarter 2013 to first quarter 2013, distressed sales as a percentage of closed sales decreased by 9.2% (15.3% v. 24.5%).
• Short sales comprised 5.7% of new listings and 8.5% of sales in the second quarter of 2013, down 3.5% and down 2.9% from the first quarter of 2013, respectively.
• Bank owned/REO properties comprised 3.3% of new listings and 6.8% of sales in the second quarter of 2013, down 2.8% and 6.3% from the first quarter of 2013, respectively.

Portland Metro when comparing percentage share of the market, second quarter 2013 to first quarter 2013:
• When comparing the second quarter 2013 to first quarter 2013, distressed sales as a percentage of new listings decreased by 5.8% (8.1% v. 13.9%).
• In a comparison of second quarter 2013 to first quarter 2013, distressed sales as a percentage of closed sales decreased by 8.8% (13.4% v. 22.2%).
• Short sales comprised 5.8% of new listings and 8.4% of sales in the second quarter of 2013, down 2.9% and 2.8% from the first quarter of 2013, respectively.
• Bank owned/REO properties comprised 2.3% of new listings and 5.0% of sales in the second quarter of 2013, down 2.9% and 6.0% from the first quarter of 2013, respectively.

Clark County when comparing percentage share of the market, second quarter 2013 to first quarter 2013:
• When comparing the second quarter 2013 to first quarter 2013, distressed sales as a percentage of new listings decreased by 7.1% (16.6% v. 23.7%).
• In a comparison of second quarter 2013 to first quarter 2013, distressed sales as a percentage of closed sales decreased by 6.3% (24.3% v. 30.6%).
• Short sales comprised 9.7% of new listings and 13.6% of sales in the second quarter of 2013, down 5.0% for new listings and 5.1% for sales when compared to the first quarter of 2013, respectively.
• Bank owned/REO properties comprised 6.9% of new listings and 10.7% of sales in the second quarter of 2013, down 2.1% and 1.2% from the first quarter of 2013, respectively.

If you’d like more information or percentages of distressed residential sales in other areas not represented by our charts, please contact us at communications@rmls.com.


Residential Distressed Properties for First Quarter (January-March) 2013

2013Q1DistressedAllThis chart shows the number of bank owned/REO properties and short sales in all areas of the RMLS™ system during the first quarter of 2013.

Below are links to additional charts for some of our larger areas.
Portland Metro Distressed Properties (1st Quarter 2013)
Clark County, WA Distressed Properties (1st Quarter 2013)
Lane County, OR Distressed Properties (1st Quarter 2013)
Douglas County, OR Distressed Properties (1st Quarter 2013)
Coos County, OR Distressed Properties (1st Quarter 2013)

Here are some additional facts about distressed residential properties in the first quarter of 2013:

All areas when comparing percentage share of the market, first quarter 2013 to fourth quarter 2012:
• When comparing the first quarter 2013 to fourth quarter 2012, distressed sales as a percentage of new listings decreased by 6.1% (15.3% v. 21.4%).
• In a comparison of the first quarter 2013 to fourth quarter 2012, distressed sales as a percentage of closed sales increased by 0.9% (24.5% v. 23.6%).
• Short sales comprised 9.2% of new listings and 11.4% of sales in the first quarter of 2013, down 2.1% and down 0.5% from the fourth quarter of 2012, respectively.
• Bank owned/REO properties comprised 6.1% of new listings and 13.1% of sales in the first quarter of 2013, down 4.0% and up 1.4% from the fourth quarter of 2012, respectively.

Portland Metro when comparing percentage share of the market, first quarter 2013 to fourth quarter 2012:
• When comparing the first quarter 2013 to fourth quarter 2012, distressed sales as a percentage of new listings decreased by 7.2% (13.9% v. 21.1%).
• In a comparison of first quarter 2013 to fourth quarter 2012, distressed sales as a percentage of closed sales decreased by 0.6% (22.2% v. 22.8%).
• Short sales comprised 8.7% of new listings and 11.2% of sales in the first quarter of 2013, down 3.3% and 1.1% from the fourth quarter of 2012, respectively.
• Bank owned/REO properties comprised 5.2% of new listings and 11.0% of sales in the first quarter of 2013, down 3.9% and up 0.5% from the fourth quarter of 2012, respectively.

Clark County when comparing percentage share of the market, first quarter 2013 to fourth quarter 2012:
• When comparing the first quarter 2013 to fourth quarter 2012, distressed sales as a percentage of new listings decreased by 3.0% (23.7% v. 26.7%).
• In a comparison of first quarter 2013 to fourth quarter 2012, distressed sales as a percentage of closed sales increased by 1.8% (30.6% v. 28.8%).
• Short sales comprised 14.7% of new listings and 18.7% of sales in the first quarter of 2013, down 3.1% for new listings and up 0.1% for sales when compared to the fourth quarter of 2012, respectively.
• Bank owned/REO properties comprised 9.0% of new listings and 11.9% of sales in the first quarter of 2013, up 0.1% and 1.7% from the fourth quarter of 2012, respectively.

If you’d like more information or percentages of distressed residential sales in other areas not represented by our charts, please contact us at communications@rmls.com.


Market Action Statistical Summaries Receive a Refresh

The archive of RMLS™ Market Action statistical summaries on RMLSweb has a fresh new look, thanks to RMLS™ Business Analyst/Policy Manager Christina Smestad.

StatisticalSummaries

If you have never seen them, statistical summaries compile many years of data from our Market Action newsletter for most areas in the RMLS™ region so readers can compare long-term market movements in key areas.

In order to improve the statistical summaries we standardized the data, added a few numbers not previously compiled, and reworked the layout to be more readable and printer-friendly. Our revised versions combine average and median sales price into one report and add inventory counts to the summary report. We think you’ll like what you see!

Available reports include average sales price, average and median sales price by area, closed sales, market percent and time by price, median sales price, new listings, pending listings, and a summary report. Affordability summaries are available for the Portland metro area, Clark County, and Lane County. Statistical summaries are currently available for those areas as well as Baker County, Columbia Basin, Coos County, Curry County, Douglas County, Mid-Columbia, Union County, and Wallowa County.

StatSumFolderThe treasury of statistical summaries may be accessed online two ways. Currently, subscribers logged in to RMLSweb may navigate to Toolkit->All Documents, then expand the folder titled “Market Action Statistical Summaries” on the left sidebar to find subgroups of specific geographic regions (see image at left).

As of March 28, a shortcut will be available allowing users to access quick links to statistical summaries directly from the RMLSweb menu. Subscribers logged in to RMLSweb may navigate to Statistics->Statistical Summaries for a more navigable list of geographic areas.

Moving forward, RMLS™ will update the statistical summaries more frequently than the annual updates of the past. We’re also working to expand the reports into other areas: Polk and Marion Counties, Grant County, North Coastal Communities, and Cowlitz County are planned additions for the future!


Residential Distressed Properties for Fourth Quarter (October-December) 2012

AllAreas4thQDistressed

This chart shows the number of bank owned properties and short sales in all areas of the RMLS™ system during the fourth quarter of 2012.

Below are links to additional charts for some of our larger areas.
Portland Metro Distressed Properties (4th Quarter 2012)
Clark County, WA Distressed Properties (4th Quarter 2012)
Lane County, OR Distressed Properties (4th Quarter 2012)
Douglas County, OR Distressed Properties (4th Quarter 2012)
Coos County, OR Distressed Properties (4th Quarter 2012)

Here are some additional facts about distressed residential properties in the fourth quarter of 2012:

All areas when comparing percentage share of the market, fourth quarter 2012 to third quarter 2012:
• When comparing the fourth quarter of 2012 to the third quarter, distressed sales as a percentage of new listings increased by 3.2% (21.4% v. 18.2%).
• In a comparison of the fourth quarter of 2012 to the third quarter, distressed sales as a percentage of closed sales decreased by 1.2% (23.6% v. 24.8%).
• Short sales comprised 11.3% of new listings and 11.9% of sales in the fourth quarter of 2012, up 1.5% and down .3% from the third quarter of 2012, respectively.
• Bank owned/REO properties comprised 10.1% of new listings and 11.7% of sales in the fourth quarter of 2012, up 1.7% and down .9% from the third quarter of 2012, respectively.

Portland Metro when comparing percentage share of the market, fourth quarter 2012 to third quarter 2012:
• When comparing the fourth quarter of 2012 to the third quarter, distressed sales as a percentage of new listings increased by 2.6% (21.1% v. 18.5%).
• In a comparison of fourth quarter 2012 to third quarter, distressed sales as a percentage of closed sales decreased by 1.4% (22.8% v. 24.2%).
• Short sales comprised 12.0% of new listings and 12.3% of sales in the fourth quarter of 2012, up 1.8% and down .2% from the third quarter of 2012, respectively.
• Bank owned/REO properties comprised 9.1% of new listings and 10.5% of sales in the fourth quarter of 2012, up .8% and down 1.2% from the third quarter of 2012, respectively.

Clark County when comparing percentage share of the market, fourth quarter 2012 to third quarter 2012:
• When comparing the fourth quarter of 2012 to the third quarter, distressed sales as a percentage of new listings increased by 2.1% (26.7% v. 24.6%).
• In a comparison of fourth quarter 2012 to third quarter 2012, distressed sales as a percentage of closed sales decreased by 1.0% (28.8% v. 29.8%).
• Short sales comprised 17.8% of new listings and 18.6% of sales in the fourth quarter of 2012, up .6% for new listings and down 1.5% for sales when compared to the third quarter of 2012, respectively.
• Bank owned/REO properties comprised 8.9% of new listings and 10.2% of sales in the fourth quarter of 2012, up 1.5% and .5% from the third quarter of 2012, respectively.

If you’d like more information or percentages of distressed residential sales in other areas not represented by our charts, please contact us at communications@rmls.com.


Residential Distressed Properties for Third Quarter (July-September) 2012

This chart shows the number of bank owned properties and short sales in all areas of the RMLS™ system during the third quarter of 2012.

Below are links to additional charts for some of our larger areas.
Portland Metro Distressed Properties (3rd Quarter 2012)
Clark County, WA Distressed Properties (3rd Quarter 2012)
Lane County, OR Distressed Properties (3rd Quarter 2012)
Douglas County, OR Distressed Properties (3rd Quarter 2012)
Coos County, OR Distressed Properties (3rd Quarter 2012)

Here are some additional facts about distressed residential properties in the third quarter of 2012:

All areas when comparing percentage share of the market, third quarter 2012 to second quarter 2012:
• When comparing the third quarter of 2012 to the second quarter, distressed sales as a percentage of new listings decreased by .6% (18.2% v. 18.8%).
• In a comparison of the third quarter of 2012 to the second quarter, distressed sales as a percentage of closed sales decreased by 5.3% (24.8% v. 30.1%).
• Short sales comprised 9.8% of new listings and 12.2% of sales in the third quarter of 2012, down .1% and up .5% from the second quarter of 2012, respectively.
• Bank owned/REO properties comprised 8.4% of new listings and 12.6% of sales in the third quarter of 2012, down .5% and 5.8% from the second quarter of 2012, respectively.

Portland Metro when comparing percentage share of the market, third quarter 2012 to second quarter 2012:
• When comparing the third quarter of 2012 to the second quarter, distressed sales as a percentage of new listings decreased by 1.4% (18.5% v. 19.9%).
• In a comparison of 3Q 2012 to 2Q, distressed sales as a percentage of closed sales decreased by 5.3% (24.2% v. 29.5%).
• Short sales comprised 10.2% of new listings and 12.5% of sales in 3Q 2012, down .3% and up 1.1% from 2Q 2012, respectively.
• Bank owned/REO properties comprised 8.3% of new listings and 11.7% of sales in 3Q 2012, down 1% and 6.4% from 2Q 2012, respectively.

Clark County when comparing percentage share of the market, third quarter 2012 to second quarter 2012:
• When comparing the third quarter of 2012 to the second quarter, distressed sales as a percentage of new listings decreased by .4% (24.6% v. 25.0%).
• In a comparison of 3Q 2012 to 2Q 2012, distressed sales as a percentage of closed sales decreased by 5.3% (29.7% v. 35%).
• Short sales comprised 17.2% of new listings and 20.1% of sales in the third quarter of 2012, down .1% for new listings and down .3% for sales when compared to the second quarter of 2012, respectively.
• Bank owned/REO properties comprised 7.4% of new listings and 9.7% of sales in the third quarter of 2012, down .4% and 4.9% from the second quarter of 2012, respectively.

If you’d like more information or percentages of distressed residential sales in other areas not represented by our charts, please contact us at communications@rmls.com.