SentriLock Lockbox Activity May 23-29, 2016

This Week’s Lockbox Activity

For the week of May 23-29, 2016, these charts show the number of times RMLS™ subscribers opened SentriLock lockboxes in Oregon and Washington. Activity decreased in both Oregon and Washington this week.

For a larger version of each chart, visit the RMLS™ photostream on Flickr.


SentriLock Lockbox Activity May 16-22, 2016

This Week’s Lockbox Activity

For the week of May 16-22, 2016, these charts show the number of times RMLS™ subscribers opened SentriLock lockboxes in Oregon and Washington. Activity increased in both Oregon and Washington this week.

For a larger version of each chart, visit the RMLS™ photostream on Flickr.


SentriLock Lockbox Activity May 9-15, 2016

This Week’s Lockbox Activity

For the week of May 9-15, 2016, these charts show the number of times RMLS™ subscribers opened SentriLock lockboxes in Oregon and Washington. Activity decreased in both Oregon and Washington this week.

For a larger version of each chart, visit the RMLS™ photostream on Flickr.


SentriLock Lockbox Activity May 2-8, 2016

This Week’s Lockbox Activity

For the week of May 2-8, 2016, these charts show the number of times RMLS™ subscribers opened SentriLock lockboxes in Oregon and Washington. Activity increased in both Oregon and Washington this week.

For a larger version of each chart, visit the RMLS™ photostream on Flickr.


SentriLock Lockbox Activity April 25-May 1, 2016

This Week’s Lockbox Activity

For the week of April 25-May 1, 2016, these charts show the number of times RMLS™ subscribers opened SentriLock lockboxes in Oregon and Washington. Activity increased in Washington but decreased in Oregon this week.

For a larger version of each chart, visit the RMLS™ photostream on Flickr.


SentriLock Lockbox Activity April 18-24, 2016

This Week’s Lockbox Activity

For the week of April 18-24, 2016, these charts show the number of times RMLS™ subscribers opened SentriLock lockboxes in Oregon and Washington. Activity decreased in both Oregon and Washington this week.

For a larger version of each chart, visit the RMLS™ photostream on Flickr.


MLS Insight: 25 Years by the Numbers (Updated May 5th)

MLS Insight is a series about how things work at RMLS™.

As we celebrate 25 years of service to the real estate community in the northwest, it is interesting to look at some of the high-level numbers that describe the business and economics of the multiple listing service.

Let’s start with the number of subscribers. In March 1991, before service had even begun, there were over 3,400 Portland-area REALTORS® committed to participating in the new multiple listing service. This March, we had 12,472 subscribers from all over Oregon and southern Washington. The March with the most subscribers was 2007 with 14,178 active REALTORS®.

The chart below shows the rise and fall of subscriber numbers (as of March of each year) plotted against total numbers of closed residential sales for the year across the entire MLS. Sales peaked in 2005 with a total of 57,745, two years prior to the peak in subscriber numbers. The number of sales has been steadily rising since the recession low of 31,028 in 2008. The 55,979 sales in 2015 were the second highest number recorded in a year at RMLS™.

Sales and Subscribers

Due to a much higher overall average sales price, the total dollar volume of residential sales posted in RMLS™, 2015 achieved a new high water mark of $17,567,003,000 despite fewer total sales than 2005. The average sales price across all RMLS™ sales in 2005 was $268,300 compared to $313,800 in 2015.

Dollar Volume

If you have questions on any RMLS™-related topic that you would like to have answered, I encourage you to post a comment.
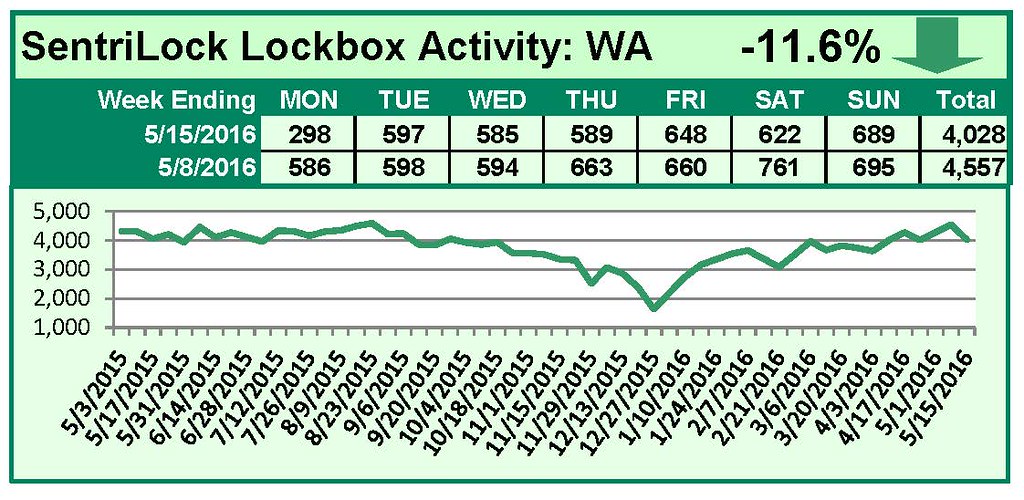
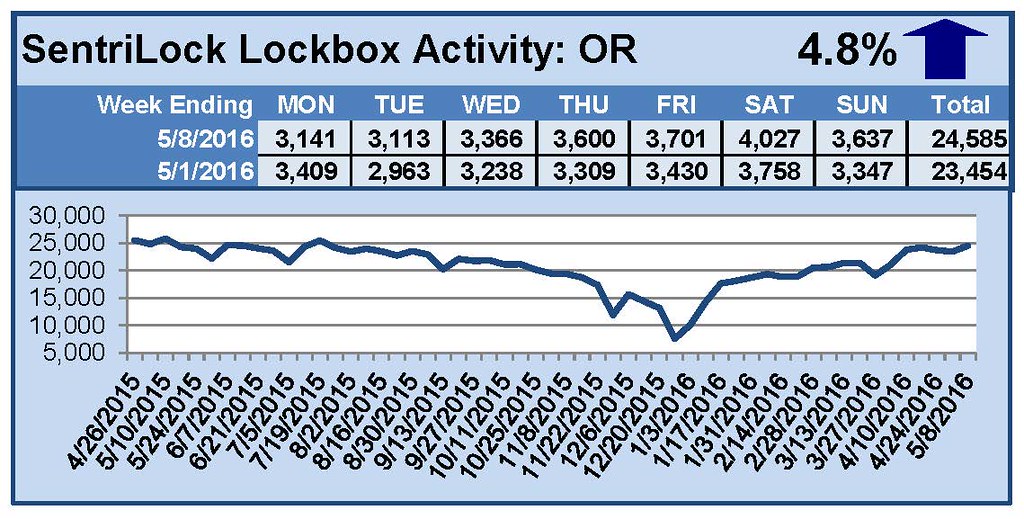
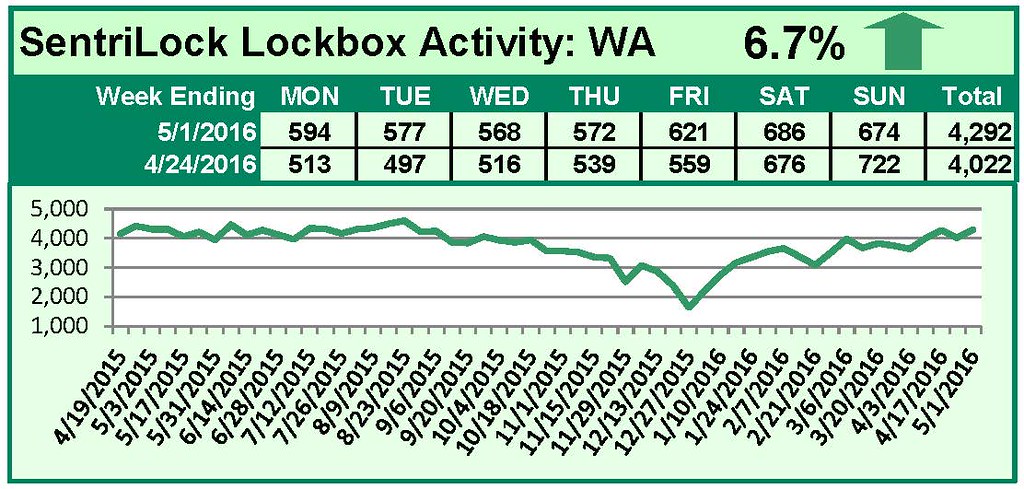
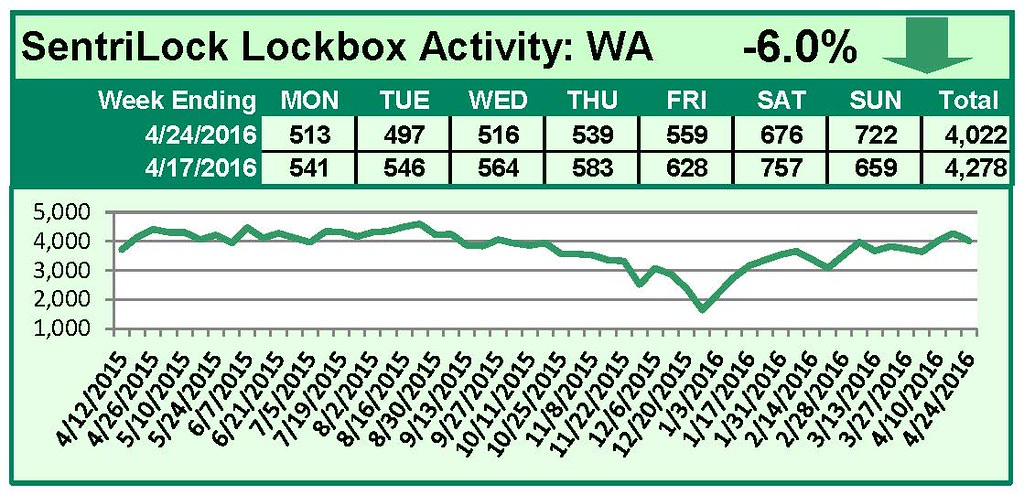

UPDATE: May 5, 2016

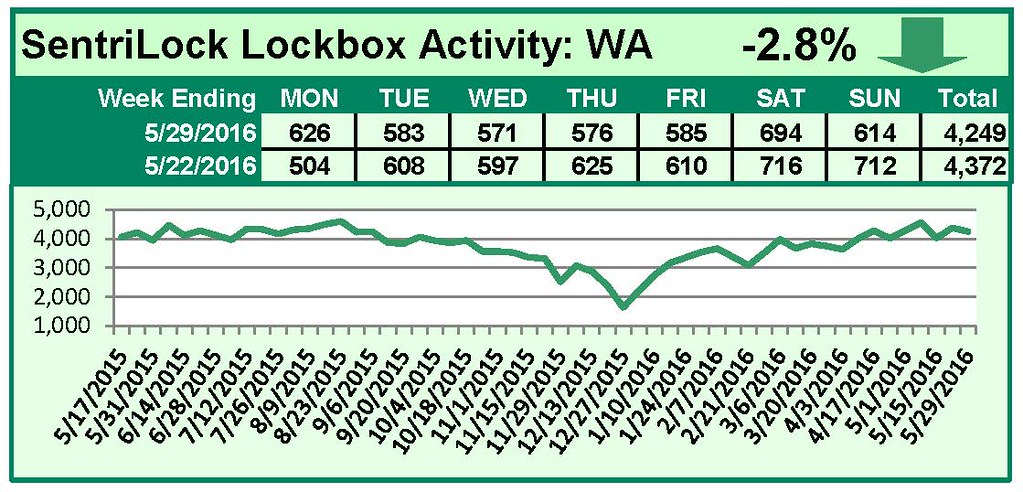
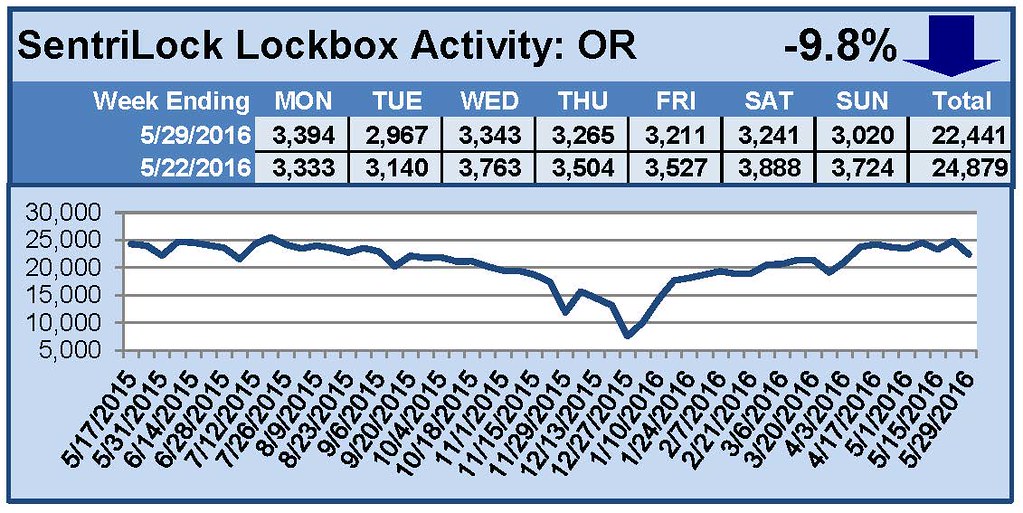
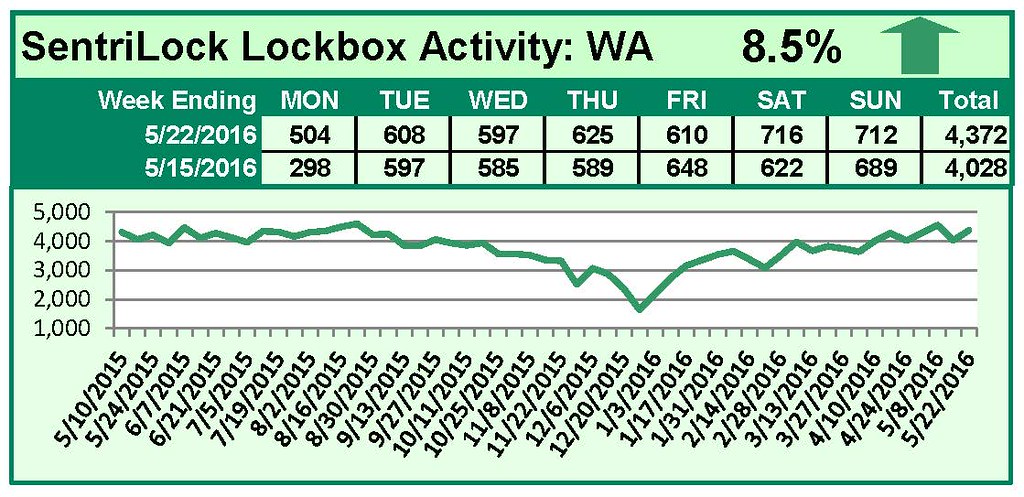
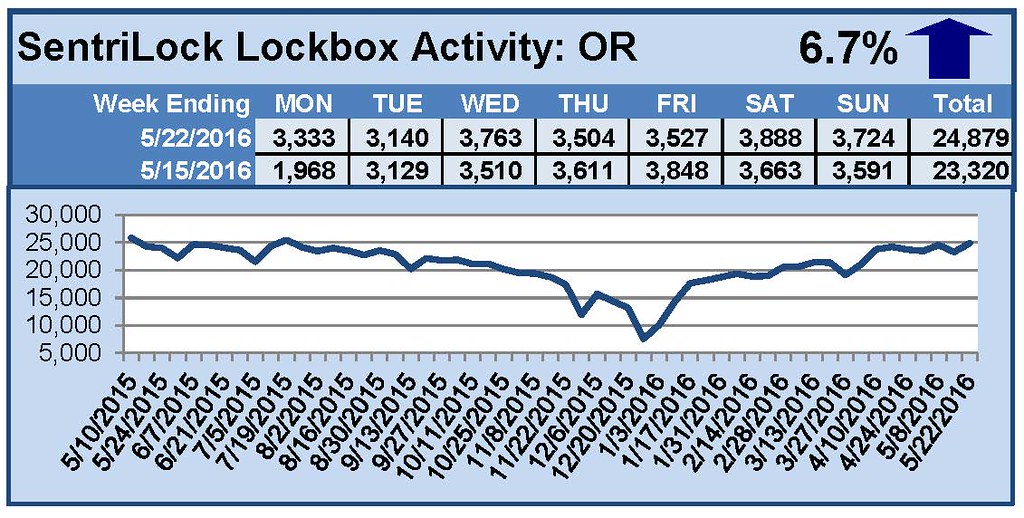
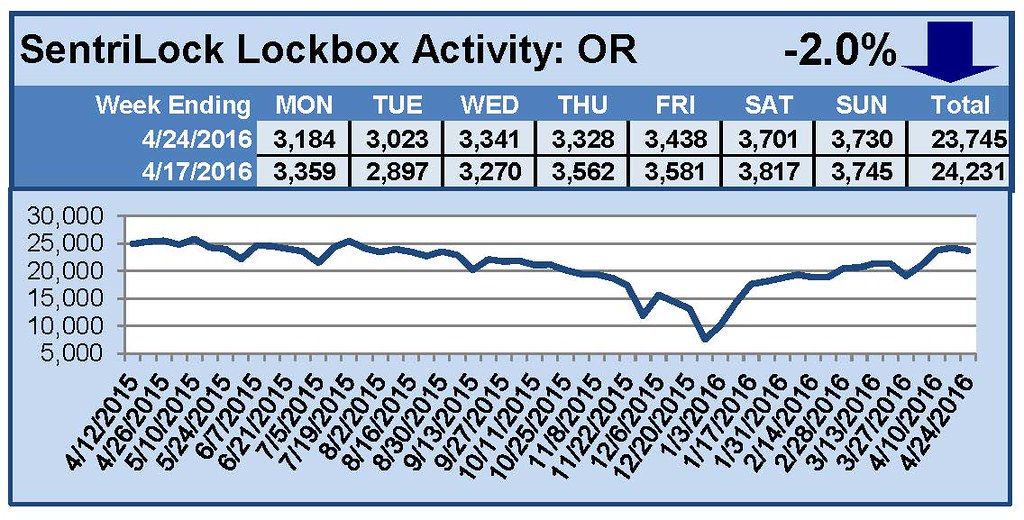
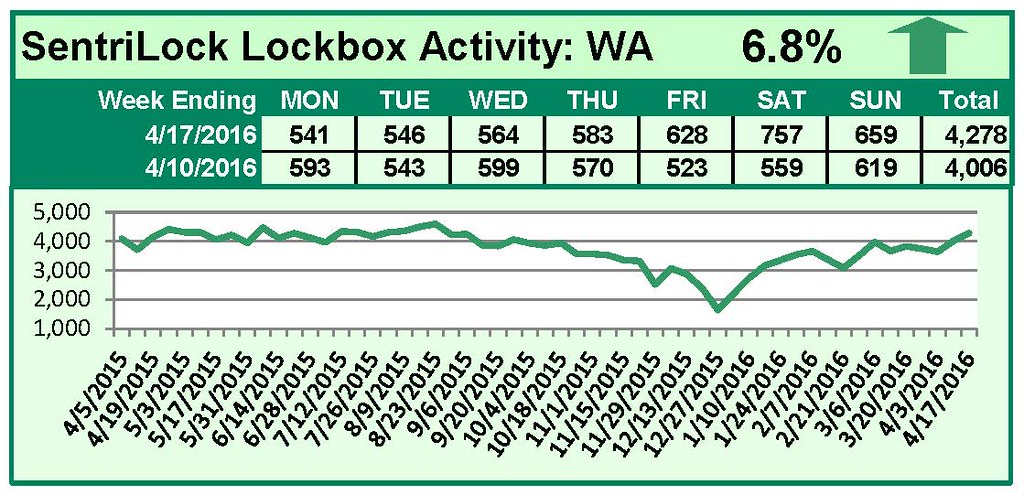
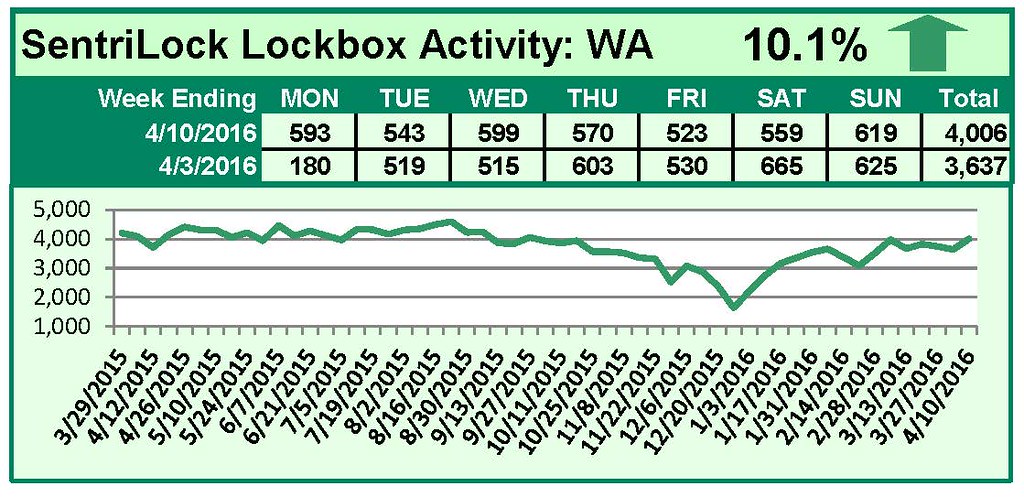
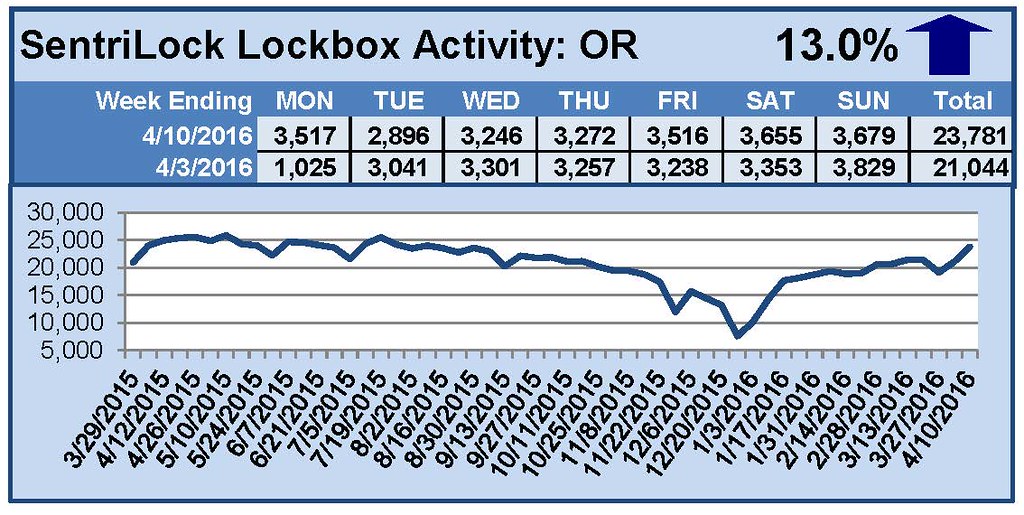
By subscriber request, here are the same graphs broken down by state:

ORWA Sales and Subscribers


ORWA Dollar Volume


SentriLock Lockbox Activity April 11-17, 2016

This Week’s Lockbox Activity

For the week of April 11-17, 2016, these charts show the number of times RMLS™ subscribers opened SentriLock lockboxes in Oregon and Washington. Activity rose in both Oregon and Washington this week.

For a larger version of each chart, visit the RMLS™ photostream on Flickr.


Residential Distressed Properties for First Quarter (January-March) 2016

AllAreasQ1DistressedSM

This chart shows the number of bank owned/REO properties and short sales in all areas of the RMLS™ system during the first quarter of 2016.

Below are links to additional charts for some of our larger areas.
Portland Metro Area Distressed Properties (1st Quarter 2016)
Clark County, WA Distressed Properties (1st Quarter 2016)
Lane County, OR Distressed Properties (1st Quarter 2016)
Douglas County, OR Distressed Properties (1st Quarter 2016)
Coos County, OR Distressed Properties (1st Quarter 2016)

Here are some additional facts about distressed residential properties in the first quarter of 2016:

All areas when comparing percentage share of the market, first quarter 2016 to fourth quarter 2015:
• When comparing first quarter 2016 to fourth quarter 2015, distressed sales as a percentage of new listings decreased by 3.0% (7.1 v. 10.1%).
• In a comparison of first quarter 2016 to fourth quarter 2015, distressed sales as a percentage of closed sales decreased by 2.1% (10.6 v. 8.5%).
• Short sales comprised 1.5% of new listings and 1.9% of sales in the first quarter of 2016, down 0.7% and up 0.2% from the fourth quarter of 2015, respectively.
• Bank owned/REO properties comprised 5.6% of new listings and 8.7% of sales in the first quarter of 2016, down 2.3% and up 1.9% from the fourth quarter of 2015, respectively.

Portland metro when comparing percentage share of the market, first quarter 2016 to fourth quarter 2015:
• When comparing first quarter 2016 to fourth quarter 2015, distressed sales as a percentage of new listings decreased by 3.2% (6.0 v. 9.2%).
• In a comparison of first quarter 2016 to fourth quarter 2015, distressed sales as a percentage of closed sales increased by 1.9% (9.6 v. 7.7%).
• Short sales comprised 1.4% of new listings and 2.2% of sales in the first quarter of 2016, down 0.7% and up 0.4% from the fourth quarter of 2015, respectively.
• Bank owned/REO properties comprised 4.6% of new listings and 7.4% of sales in the first quarter of 2016, down 2.5% and up 1.5% from the fourth quarter of 2015, respectively.

Clark County when comparing percentage share of the market, first quarter 2016 to fourth quarter 2015:
• When comparing first quarter 2016 to fourth quarter 2015, distressed sales as a percentage of new listings decreased by 1.2% (5.8 v. 7.0%).
• In a comparison of first quarter 2016 to fourth quarter 2015, distressed sales as a percentage of closed sales remained unchanged (6.0 v. 6.0%).
• Short sales comprised 2.5% of new listings and 1.9% of sales in the first quarter of 2016, down 0.9% for new listings and exactly matching sales when compared to the fourth quarter of 2015, respectively.
• Bank owned/REO properties comprised 3.3% of new listings and 4.1% of sales in the first quarter of 2016, down 0.3% and exactly matching the fourth quarter of 2015, respectively.

If you’d like more information or percentages of distressed residential sales in other areas not represented by our charts, please contact us at communications@rmls.com.


SentriLock Lockbox Activity April 4-10, 2016

This Week’s Lockbox Activity

For the week of April 4-10, 2016, these charts show the number of times RMLS™ subscribers opened SentriLock lockboxes in Oregon and Washington. Activity rose in both Oregon and Washington this week.

For a larger version of each chart, visit the RMLS™ photostream on Flickr.