SentriLock Lockbox Activity January 18-24, 2016

This Week’s Lockbox Activity

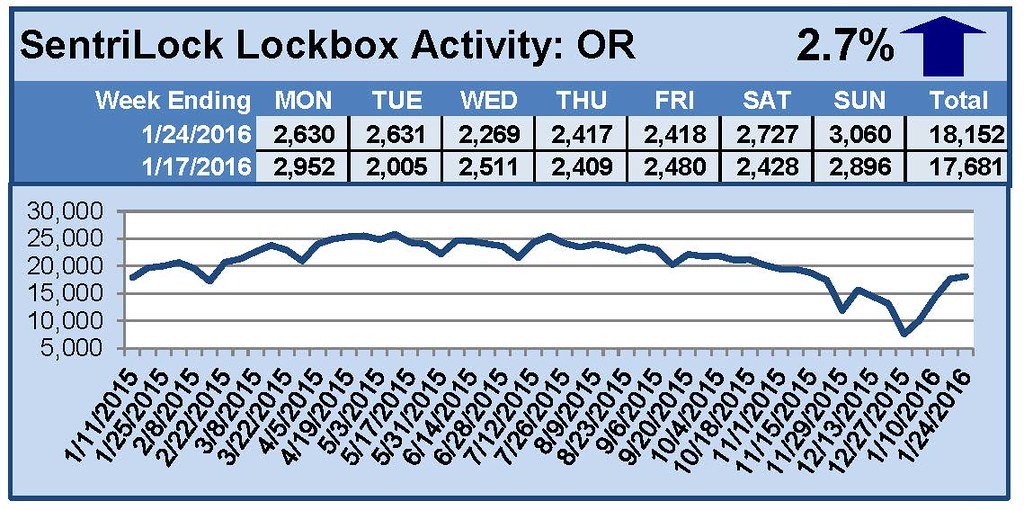
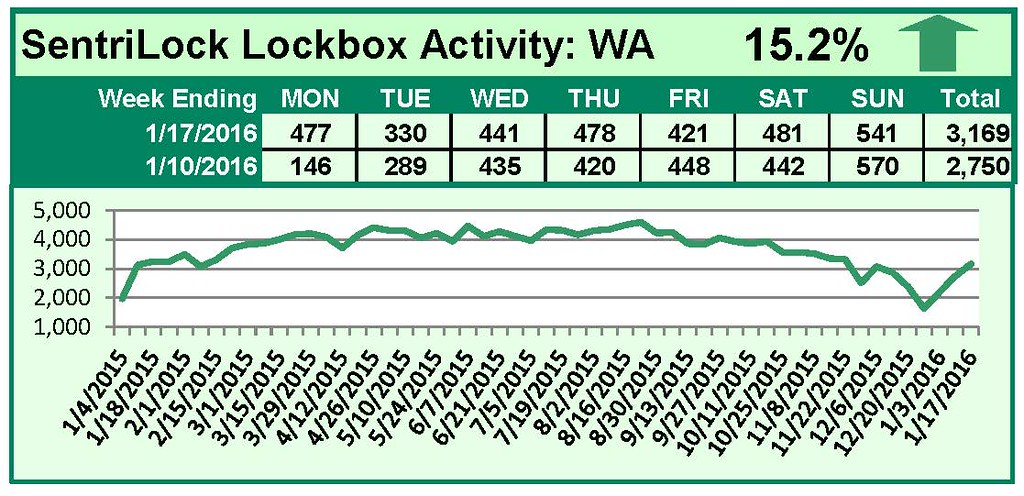
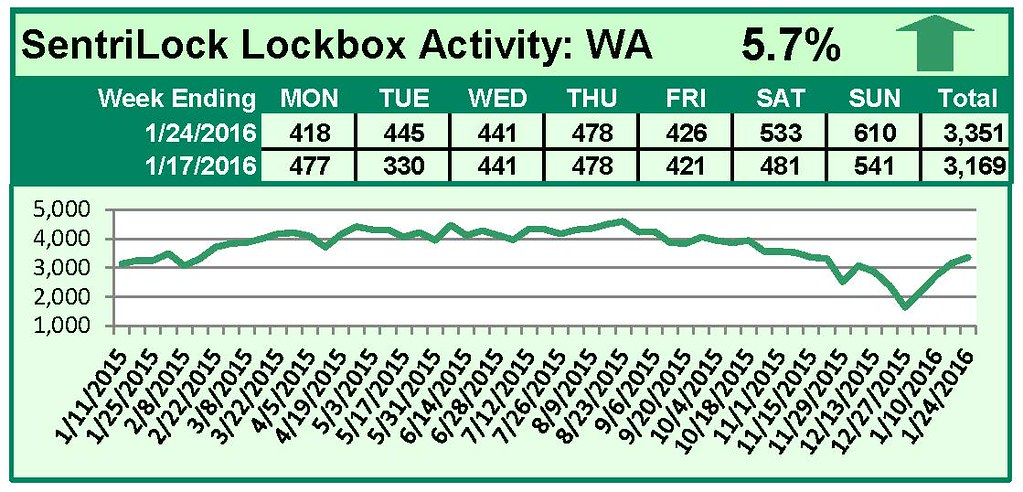
For the week of January 18-24, 2016, these charts show the number of times RMLS™ subscribers opened SentriLock lockboxes in Oregon and Washington. Activity in Oregon and Washington increased again this week.

For a larger version of each chart, visit the RMLS™ photostream on Flickr.


2015 Distressed Residential Properties

The chart below shows the number of bank owned/REO and short sales in all areas of the RMLS™ system during 2015.

ALL AREAS 2015 Distressed Properties

All areas when comparing percentage share of the market 2014 to 2015:
• Comparing 2014 to 2015, distressed sales as a percentage of closed sales decreased from 10.4% to 8.8%.
• New listings increased from 68,291 to 73,624, which is a 7.8% increase.
• Short sales comprised 2.0% of new listings and 2.2% of sold listings in 2015, down 1.3% and 1.9% from 2014 respectively as a percentage of the market.
• Bank owned/REO properties comprised 5.6% of new listings and 6.6% of sales in 2015, increasing from 5.2% and 6.3%, respectively, in 2014.

Portland metro when comparing percentage share of the market 2014 to 2015:
• Comparing 2014 to 2015, distressed sales as a percentage of closed sales decreased from 8.6% to 7.4%.
• New listings rose from 37,283 to 40,427, which is a 8.4% increase.
• Short sales comprised 1.9% of new listings and 2.1% of sold listings in 2015, down 1.4% and 1.8% from 2014 respectively as a percentage of the market.
• Bank owned/REO properties comprised 4.8% of new listings and 5.3% of sales in 2015, increasing from 4.2% and 4.7%, respectively, in 2014.

Clark County when comparing percentage share of the market 2014 to 2015:
• Comparing 2014 to 2015, distressed sales as a percentage of closed sales decreased from 14.6% to 8.3%.
• New listings rose from 9,607 to 10,506, which is a 9.4% increase.
• Short sales comprised 2.9% of new listings and 3.0% of sold listings in 2015, down 1.8% and 3.2% from 2014 as a percentage of the market.
• Bank owned/REO properties comprised 3.5% of new listings and 5.3% of sales in 2015, decreasing from 5.8% and 8.4% respectively in 2014.

Below are links to additional charts for some of our larger areas:
Portland Metro Area
Clark County, WA
Lane County, OR
Douglas County, OR
Coos County, OR

If you want information on percentages of distressed sales in other areas not represented by our charts, please contact us at communications@rmls.com.


Residential Distressed Properties for Fourth Quarter (October-December) 2015

AllAreas4QDistressedSM

This chart shows the number of bank owned/REO properties and short sales in all areas of the RMLS™ system during the fourth quarter of 2015.

Below are links to additional charts for some of our larger areas.
Portland Metro Area Distressed Properties (4th Quarter 2015)
Clark County, WA Distressed Properties (4th Quarter 2015)
Lane County, OR Distressed Properties (4th Quarter 2015)
Douglas County, OR Distressed Properties (4th Quarter 2015)
Coos County, OR Distressed Properties (4th Quarter 2015)

Here are some additional facts about distressed residential properties in the fourth quarter of 2015:

All areas when comparing percentage share of the market, fourth quarter to third quarter 2015:
• When comparing fourth quarter to third quarter 2015, distressed sales as a percentage of new listings increased by 3.7% (10.1 v. 6.4%).
• In a comparison of fourth quarter to third quarter 2015, distressed sales as a percentage of closed sales increased by 0.9% (8.5 v. 7.6%).
• Short sales comprised 2.2% of new listings and 1.7% of sales in the fourth quarter, up 0.7% and down 0.2% from the third quarter of 2015, respectively.
• Bank owned/REO properties comprised 7.9% of new listings and 6.8% of sales in the fourth quarter, up 3.0% and 1.1% from the third quarter of 2015, respectively.

Portland metro when comparing percentage share of the market, fourth quarter to third quarter 2015:
• When comparing fourth quarter to third quarter 2015, distressed sales as a percentage of new listings increased by 3.8% (9.2 v. 5.4%).
• In a comparison of fourth quarter to third quarter 2015, distressed sales as a percentage of closed sales increased by 1.3% (7.7 v. 6.4%).
• Short sales comprised 2.1% of new listings and 1.8% of sales in the fourth quarter, up 0.7% and 0.1% from the third quarter of 2015, respectively.
• Bank owned/REO properties comprised 7.1% of new listings and 5.9% of sales in the fourth quarter, up 3.1% and 1.2% from the third quarter of 2015, respectively.

Clark County when comparing percentage share of the market, fourth quarter 2015 to third quarter 2015:
• When comparing fourth quarter to third quarter 2015, distressed sales as a percentage of new listings increased by 2.0% (7.0 v. 5.0%).
• In a comparison of fourth quarter to third quarter 2015, distressed sales as a percentage of closed sales decreased by 0.3% (6.0 v. 6.3%).
• Short sales comprised 3.4% of new listings and 1.9% of sales in the fourth quarter, up 1.5% for new listings and down 0.7% for sales when compared to the third quarter of 2015, respectively.
• Bank owned/REO properties comprised 3.6% of new listings and 4.1% of sales in the fourth quarter, up 0.5% and 0.4% from the third quarter of 2015, respectively.

If you’d like more information or percentages of distressed residential sales in other areas not represented by our charts, please contact us at communications@rmls.com.


SentriLock Lockbox Activity January 11-17, 2016

This Week’s Lockbox Activity

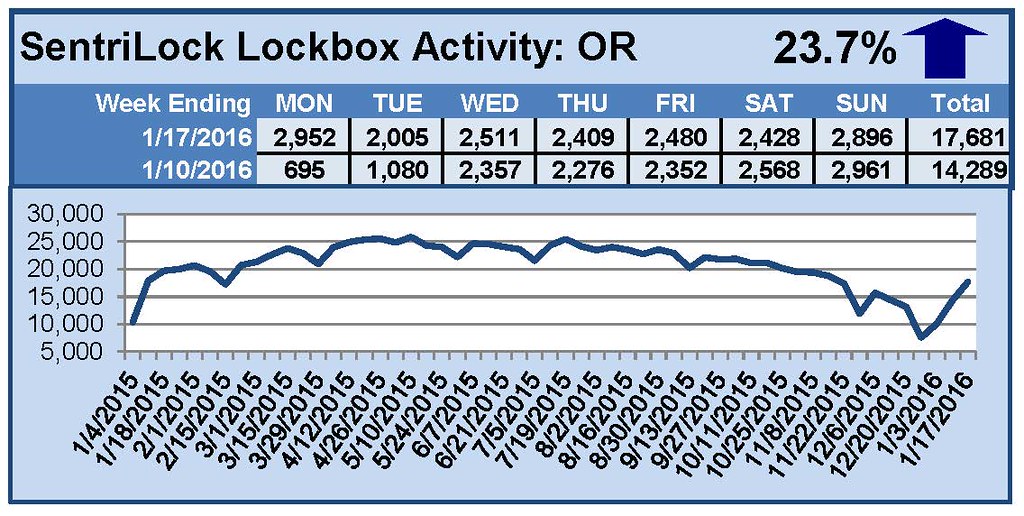
For the week of January 11-17, 2016, these charts show the number of times RMLS™ subscribers opened SentriLock lockboxes in Oregon and Washington. Activity in Oregon and Washington increased again this week.

For a larger version of each chart, visit the RMLS™ photostream on Flickr.


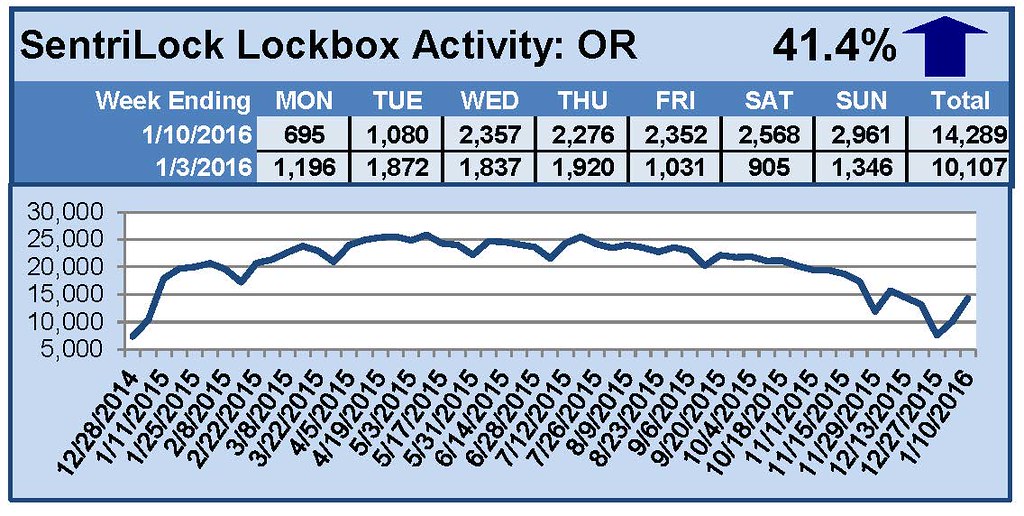
SentriLock Lockbox Activity January 4-10, 2016

This Week’s Lockbox Activity

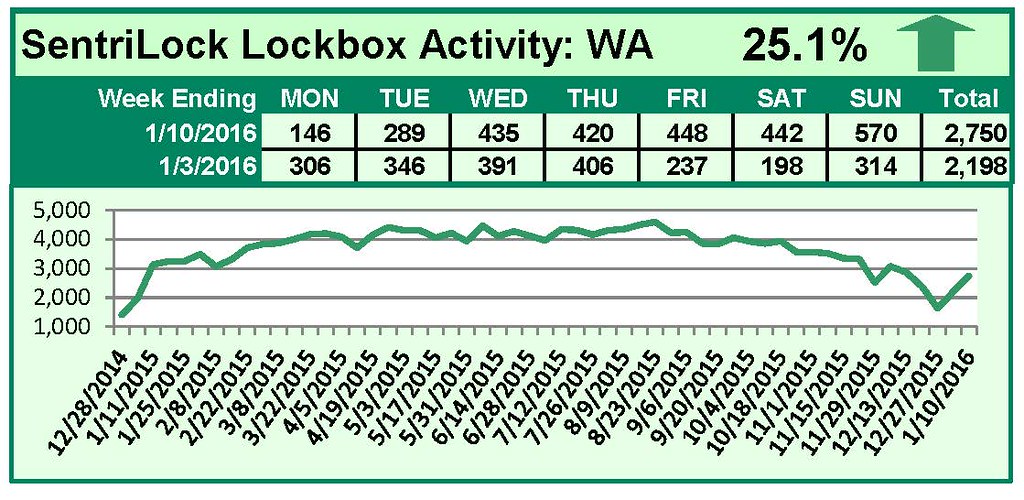
For the week of January 3-10, 2016, these charts show the number of times RMLS™ subscribers opened SentriLock lockboxes in Oregon and Washington. Activity in Oregon and Washington increased this week.

For a larger version of each chart, visit the RMLS™ photostream on Flickr.


RMLS™ by the Numbers 2015

How much work does RMLS™ do for the thousands of subscribers across Oregon and Southwest Washington? We’ve compiled the following numbers for the third year in a row to show just how much RMLS™ has supported real estate activity over the course of a single year.

RMLSweb
Number of times subscribers logged in to RMLSweb: 1,787,385
Photos uploaded to listings: 1,161,918
Property searches run: 549,388
Number of new prospect profiles created: 75,750
All residential properties listed for sale: 74,585
All residential properties sold: 57,860
Median sold price of homes listed: $270,000
Total dollar volume of homes sold: $17,999,392,000
Unique tax searches: 111,038
Reports viewed: 10,523,082
Broker tour searches run: 13,049
Open house searches run: 9,867
Statistical searches run: 29,062

RMLS™ Subscribers
RMLS™ subscribers as of December 2015: 12,213
New RMLS™ subscribers (compared to December 2014): 934
Increase in subscribers, above: +8.2%
Subscribers who attended training: 3,412
Number of calls to the RMLS™ Help Desk: 21,115
Number of Help Desk chats: 3,707
Number of incidents reported using the “Report Issue” button: 6,678
CE hours distributed by RMLS™ at no cost to subscribers: 2,310
Total attendance at RMLS™ training events: 4,567

RMLS.com
Total customer visits to RMLS.com: 3,623,006
Unique visits: 1,203,729
Total listing views: 2,377,287

Social Media
RMLS™ followers on Facebook (December 31st): 3,255
RMLS™ followers on Twitter (December 31st): 2,646

RMLS™ regularly compiles plenty of other numbers as well! In addition to publishing Market Action each month, we have statistical summaries available on RMLSweb with information dating back several years. Since 2012 we’ve also been compiling statistics about residential distressed properties in RMLSweb.

We love numbers here at RMLS™, and hope you find this data as fun and interesting as we do.


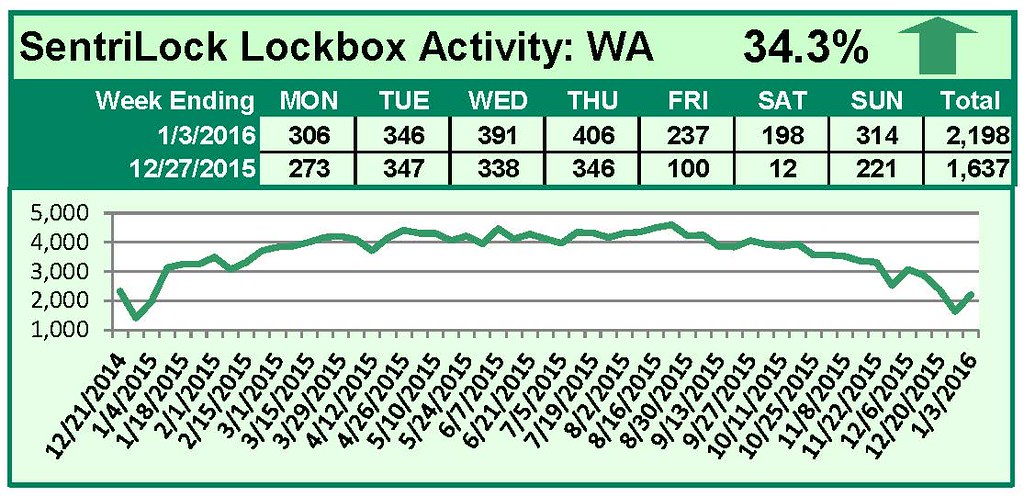
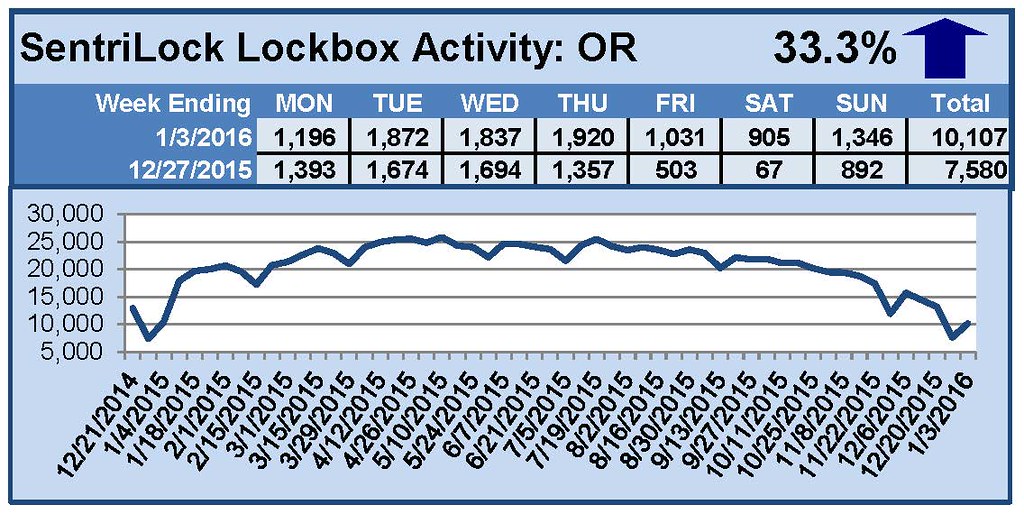
SentriLock Lockbox Activity December 28, 2015-January 3, 2016

This Week’s Lockbox Activity

For the week of December 28, 2015-January 3, 2016, these charts show the number of times RMLS™ subscribers opened SentriLock lockboxes in Oregon and Washington. Activity in Oregon and Washington increased this week.

For a larger version of each chart, visit the RMLS™ photostream on Flickr.


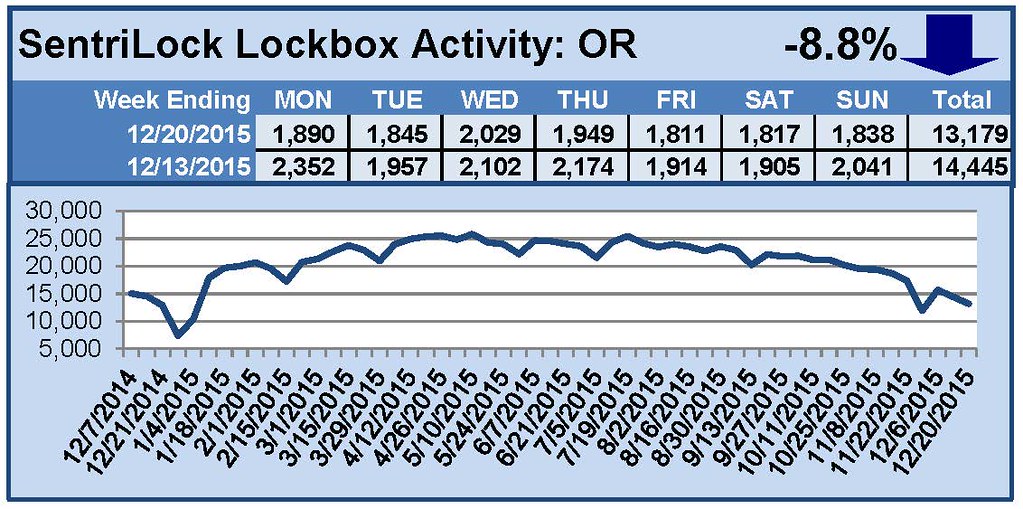
SentriLock Lockbox Activity December 14-20, 2015

This Week’s Lockbox Activity

For the week of December 14-20, 2015, these charts show the number of times RMLS™ subscribers opened SentriLock lockboxes in Oregon and Washington. Activity decreased in both Oregon and Washington this week.

For a larger version of each chart, visit the RMLS™ photostream on Flickr.


MLS Insight: Looking Back at 2015

Turning of the YearMLS Insight is a series about how things work at RMLS™.

Before we plunge headlong into the new year, let’s take one last look back at 2015.

It was a year of growth and change, energized by real estate market conditions. Closed sales recorded through November approached or exceeded 120% of closed sales in the previous year in almost every area served by RMLS™. This translates into a 20% increase in dollar volume of transactions. 2014 posted approximately $15 billion in sales, and 2015 will see over $18 billion in volume for all properties sold through RMLS™.

The improvement in real estate prospects has not gone unnoticed by job seekers. RMLS™ started the year with 10,676 subscribers and is projected to end 2015 with over 12,200 subscribers, an increase of 14%.

Some highlights of 2015 for RMLS™:

  • Eight new RMLS™ classes were added to the list over the course of the year, including RPR Basics, SentriLock Essentials, Android Essentials, iOS Essentials, Utilizing RMLSweb Statistics, RMLS™ Rules and Regulations, RMLS™ Rules and Regulations Jeopardy, and Mobile Apps for REALTORS®. (To register for any of these classes, please contact training@rmls.com or call the Help Desk at 503-872-8002 or 877-256-2169 toll free.)
  • RMLS™ was invited and became a Home Energy Info Accelerator Partner in May, when that US Department of Energy program was established.
  • A listing forms change in July featured a new supplement for green/energy information.
  • We became the fifth MLS in the nation to be certified with RESO (Real Estate Standards Organization) Data Dictionary version 1.3 in August. (We went on to surpass that level in December and were certified compliant at 1.4 Silver.)
  • A new photo loader was introduced on RMLSweb in October which allows up to 32 images per listing and features high-resolution imagery and built-in basic editing tools.
  • A new Beaverton training venue was inaugurated in November.
  • A new mapping interface for RMLSweb was released in December.
  • The Financial Tools on RMLSweb were modified to work with multiple browsers in February and the outdated default values within the tools were updated in December.

LOGO_Blue_nomlsWe want to take this opportunity to say a special thank all of our subscribers. We appreciate the opportunity to serve you and look forward to sharing our 25th anniversary celebration with you in 2016.
If you have questions on any RMLS™-related topic that you would like to have answered, I encourage you to post a comment.


SentriLock Lockbox Activity December 7-13, 2015

This Week’s Lockbox Activity

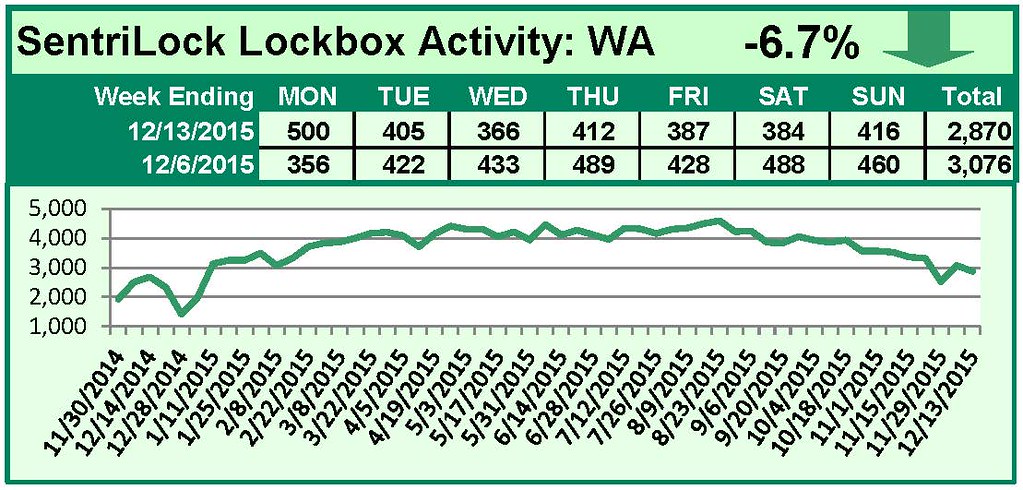
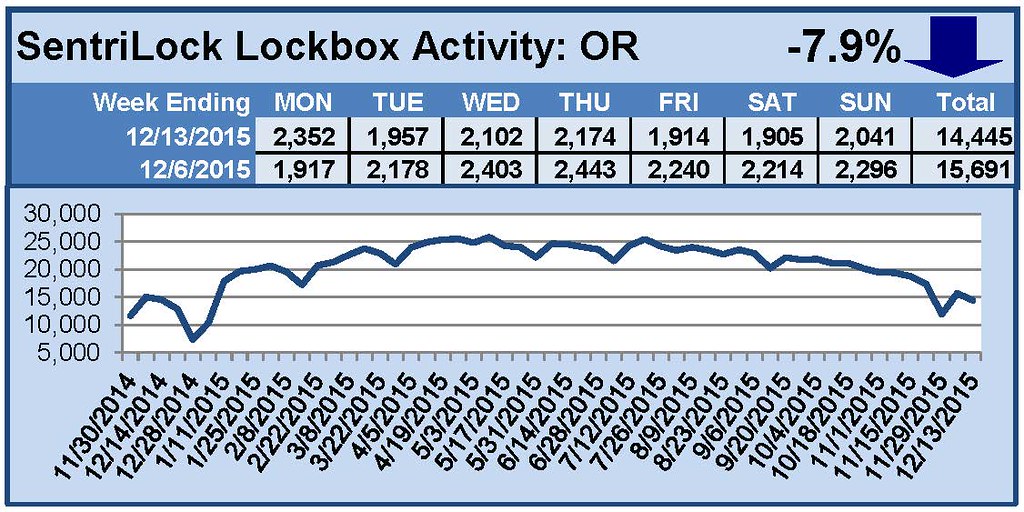
For the week of December 7-13, 2015, these charts show the number of times RMLS™ subscribers opened SentriLock lockboxes in Oregon and Washington. Activity decreased in both Oregon and Washington this week.

For a larger version of each chart, visit the RMLS™ photostream on Flickr.