The chart below shows the number of bank owned/REO and short sales in all areas of the RMLS™ system during 2014.
 All areas when comparing percentage share of the market 2013 to 2014:
• Comparing 2013 to 2014, distressed sales as a percentage of closed sales decreased from 15.1% to 10.4%.
• New listings increased from 65,206 to 68,291, which is a 4.7% increase.
• Short sales comprised 3.3% of new listings and 4.1% of sold listings in 2014, down 3.1% and 4.0% from 2013 respectively as a percentage of the market.
• Bank owned/REO properties comprised 5.2% of new listings and 6.3% of sales in 2014, increasing from 4.5% and decreasing from 7.0%, respectively, in 2013.
Portland metro when comparing percentage share of the market 2013 to 2014:
• Comparing 2013 to 2014, distressed sales as a percentage of closed sales decreased from 13.2% to 8.6%.
• New listings rose from 35,524 to 37,283, which is a 4.9% increase.
• Short sales comprised 3.3% of new listings and 3.9% of sold listings in 2014, down 3.1% and 4.1% from 2013 respectively as a percentage of the market.
• Bank owned/REO properties comprised 4.2% of new listings and 4.7% of sales in 2014, increasing from 3.3% and decreasing from 5.2%, respectively, in 2013.
Clark County when comparing percentage share of the market 2013 to 2014:
• Comparing 2013 to 2014, distressed sales as a percentage of closed sales decreased from 22.4% to 14.6%.
• New listings rose from 9,079 to 9,607, which is a 5.8% increase.
• Short sales comprised 4.7% of new listings and 6.2% of sold listings in 2014, down 5.3% and 6.5% from 2013 as a percentage of the market.
• Bank owned/REO properties comprised 5.8% of new listings and 8.4% of sales in 2014, decreasing from 7.8% and 9.7% respectively in 2013.
Below are links to additional charts for some of our larger areas:
Portland Metro Area
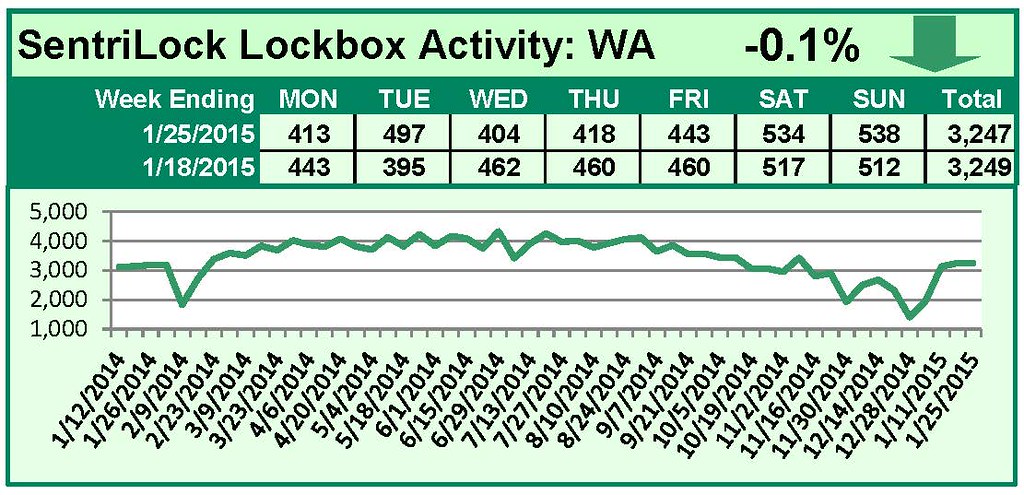
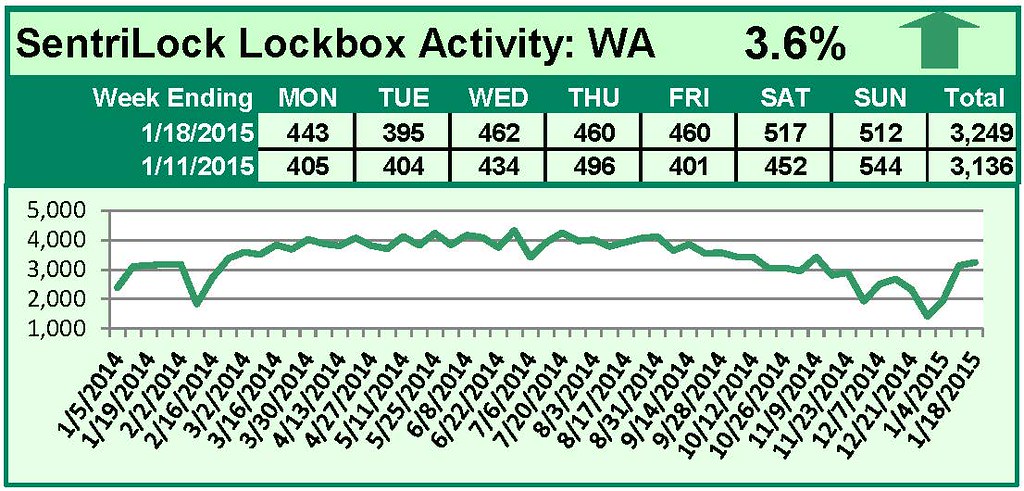
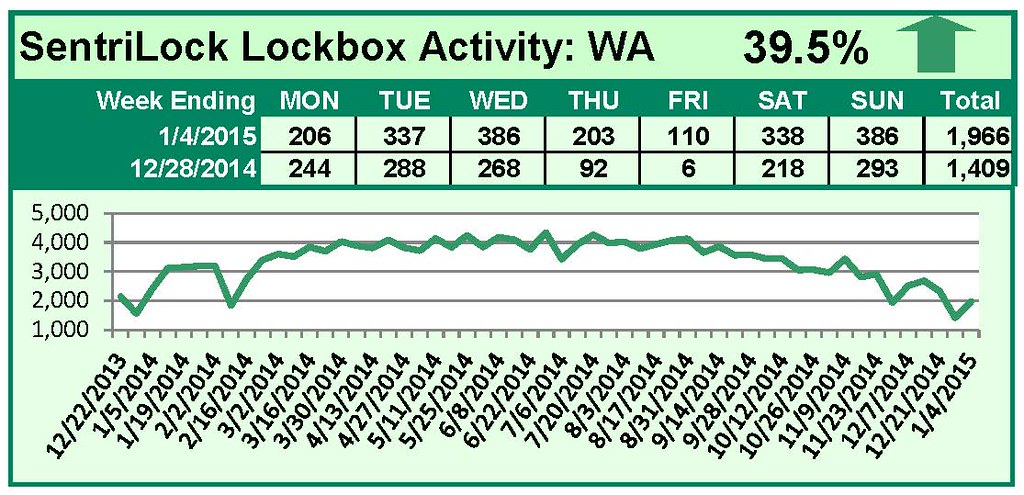
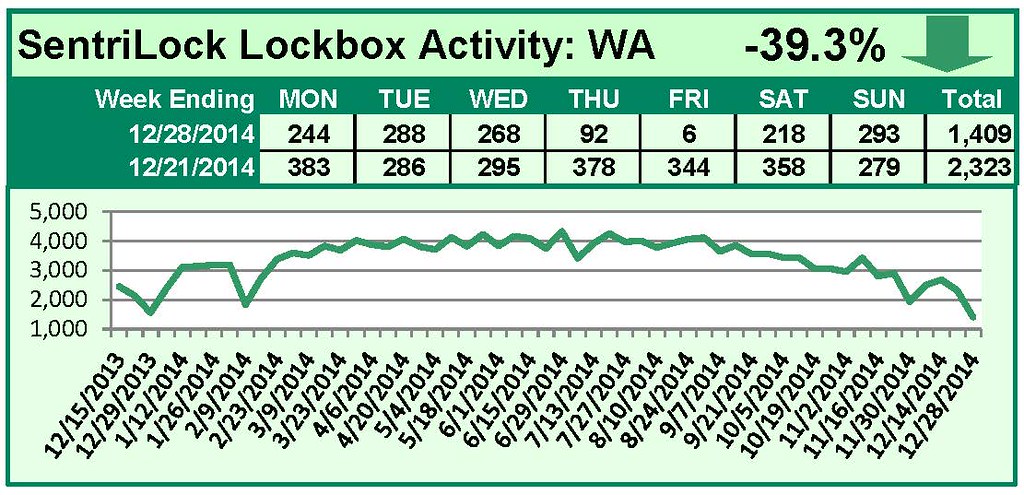
Clark County, WA
Lane County, OR
Douglas County, OR
Coos County, OR
If you want information on percentages of distressed sales in other areas not represented by our charts, please contact us at communications@rmls.com.