SentriLock Lockbox Activity January 13-19, 2014

This Week’s Lockbox Activity

For the week of January 13-19, 2014, these charts show the number of times RMLS™ subscribers opened SentriLock lockboxes in Oregon and Washington. Showings rose in both states this week.

For a larger version of each chart, visit the RMLS™ photostream on Flickr.

Please note: due to the RMLS™ transition to SentriLock, historical data is only currently available through the RMLS™ Flickr page, under the tag “Supra lockbox activity.” SentriLock data will continue accumulating until each chart represents a year of data.


Residential Distressed Properties for Fourth Quarter (October-December) 2013

AllAreas4thQDistressedThis chart shows the number of bank owned/REO properties and short sales in all areas of the RMLS™ system during the fourth quarter of 2013.

Below are links to additional charts for some of our larger areas.
Portland Metro Distressed Properties (4th Quarter 2013)
Clark County, WA Distressed Properties (4th Quarter 2013)
Lane County, OR Distressed Properties (4th Quarter 2013)
Douglas County, OR Distressed Properties (4th Quarter 2013)
Coos County, OR Distressed Properties (4th Quarter 2013)

Here are some additional facts about distressed residential properties in the fourth quarter of 2013:

All areas when comparing percentage share of the market, fourth quarter 2013 to third quarter 2013:
• When comparing the fourth quarter 2013 to third quarter 2013, distressed sales as a percentage of new listings increased by 3.9% (12.5 v. 8.6%).
• In a comparison of the fourth quarter 2013 to third quarter 2013, distressed sales as a percentage of closed sales increased by 0.8% (12.1 v. 11.3%).
• Short sales comprised 6.0% of new listings and 6.8% of sales in the fourth quarter of 2013, up 0.9% and 0.2% from the third quarter of 2013, respectively.
• Bank owned/REO properties comprised 6.5% of new listings and 5.3% of sales in the fourth quarter of 2013, up 3.0% and 0.6% from the third quarter of 2013, respectively.

Portland Metro when comparing percentage share of the market, fourth quarter 2013 to third quarter 2013:
• When comparing the fourth quarter 2013 to third quarter 2013, distressed sales as a percentage of new listings increased by 3.1% (10.6% v. 7.5%).
• In a comparison of fourth quarter 2013 to third quarter 2013, distressed sales as a percentage of closed sales increased by 1.4% (10.8% v. 9.4%).
• Short sales comprised 6.0% of new listings and 7.2% of sales in the fourth quarter of 2013, up 0.7% and 0.9% from the third quarter of 2013, respectively.
• Bank owned/REO properties comprised 4.6% of new listings and 3.6% of sales in the fourth quarter of 2013, up 2.4% and 0.5% from the third quarter of 2013, respectively.

Clark County when comparing percentage share of the market, fourth quarter 2013 to third quarter 2013:
• When comparing the fourth quarter 2013 to third quarter 2013, distressed sales as a percentage of new listings increased by 4.7% (18.6% v. 13.9%).
• In a comparison of fourth quarter 2013 to third quarter 2013, distressed sales as a percentage of closed sales decreased by 1.9% (17.6% v. 19.5%).
• Short sales comprised 8.2% of new listings and 9.1% of sales in the fourth quarter of 2013, up 0.6% for new listings and down 2.0% for sales when compared to the third quarter of 2013, respectively.
• Bank owned/REO properties comprised 10.4% of new listings and 8.5% of sales in the fourth quarter of 2013, up 4.1% and up 0.1% from the third quarter of 2013, respectively.

If you’d like more information or percentages of distressed residential sales in other areas not represented by our charts, please contact us at communications@rmls.com.


SentriLock Lockbox Activity January 6-12, 2014

This Week’s Lockbox Activity

For the week of January 6-12, 2014, these charts show the number of times RMLS™ subscribers opened SentriLock lockboxes in Oregon and Washington. Showings rose significantly in both states this week.

For a larger version of each chart, visit the RMLS™ photostream on Flickr.

Please note: due to the RMLS™ transition to SentriLock, historical data is only currently available through the RMLS™ Flickr page, under the tag “Supra lockbox activity.” SentriLock data will continue accumulating until each chart represents a year of data.


SentriLock Lockbox Activity December 30, 2013-January 5, 2014

This Week’s Lockbox Activity

For the week of December 30, 2013-January 5, 2014, these charts show the number of times RMLS™ subscribers opened SentriLock lockboxes in Oregon and Washington. Showings increased significantly in both states this week.

For a larger version of each chart, visit the RMLS™ photostream on Flickr.

Please note: due to the RMLS™ transition to SentriLock, historical data is only currently available through the RMLS™ Flickr page, under the tag “Supra lockbox activity.” SentriLock data will continue accumulating until each chart represents a year of data.


RMLS™ by the Numbers 2013

Just how big is RMLS™ anyway? We thought it would be fun and interesting to compile numbers showing just how much RMLS™ has supported real estate activity in 2013. This is our first year doing it, but we hope to continue collecting these numbers in order to also see how the company is expanding over time.

RMLSweb
Number of times subscribers logged in to RMLSweb: 6,185,000
Photos uploaded to listings: 926,490
Property searches run: 422,049
Number of new prospect profiles created: 57,599
All residential properties listed for sale: 65,824
All residential properties sold: 45,243
Median sold price of homes listed: $235,000
Total dollar volume of homes sold: $12,373,855,000
Unique tax searches: 103,077
Hit count reports viewed and auto-emailed to sellers: 12,608,195
Broker tour searches run: 12,475
Open house searches run: 7,357
Statistical searches run: 51,745

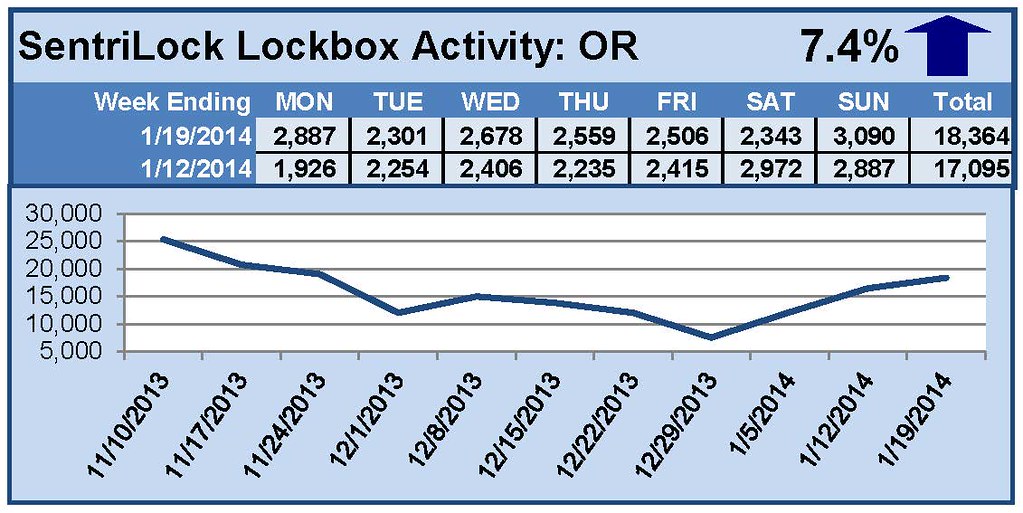
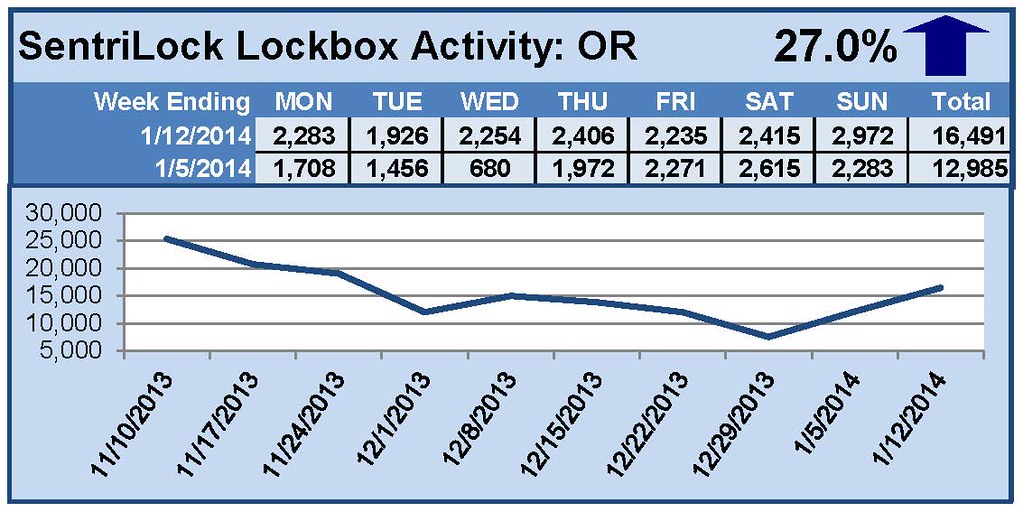
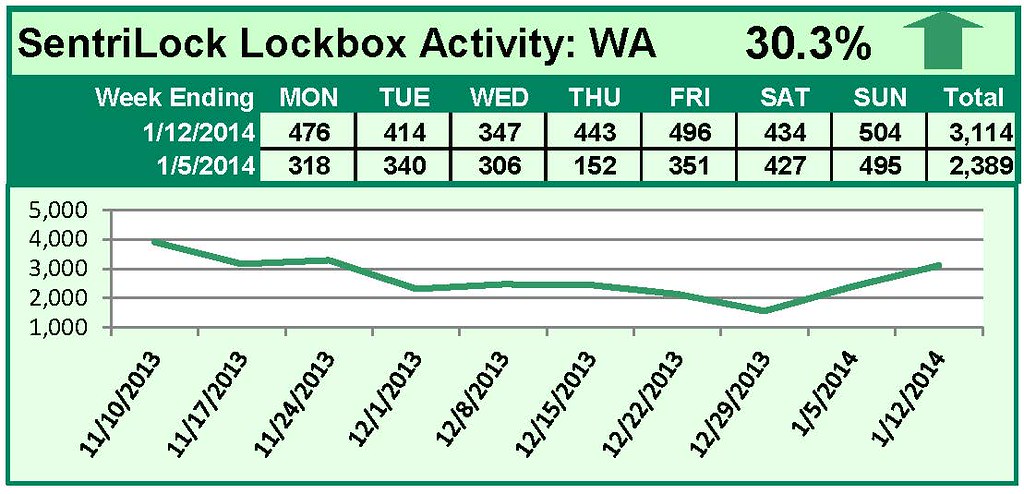
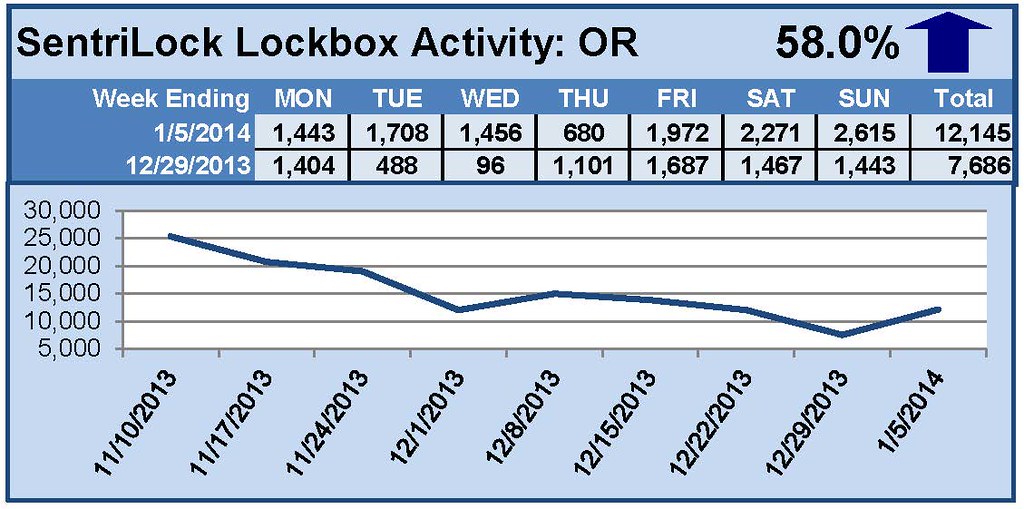
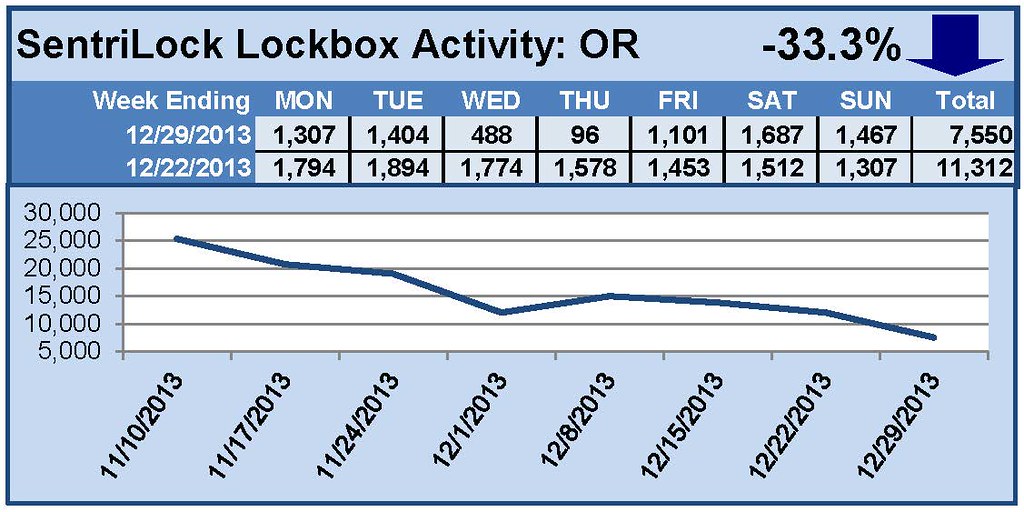
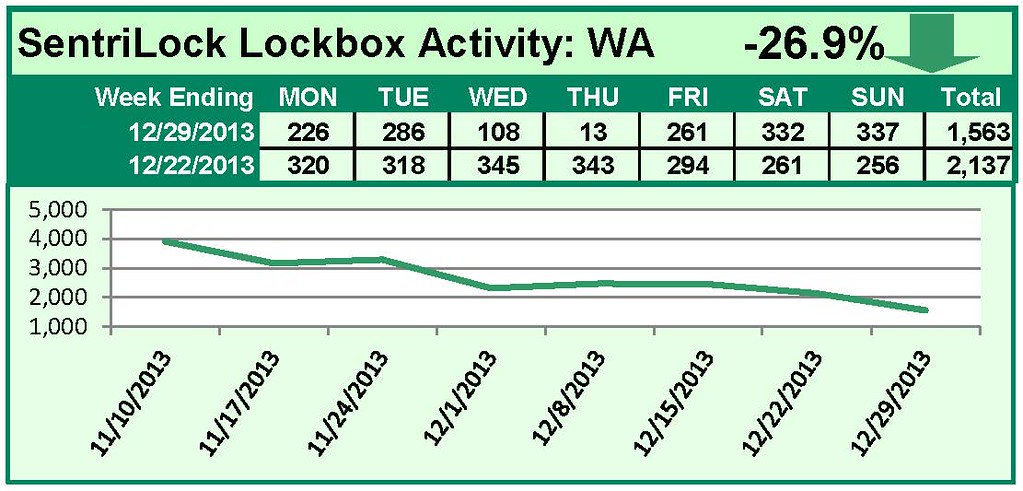
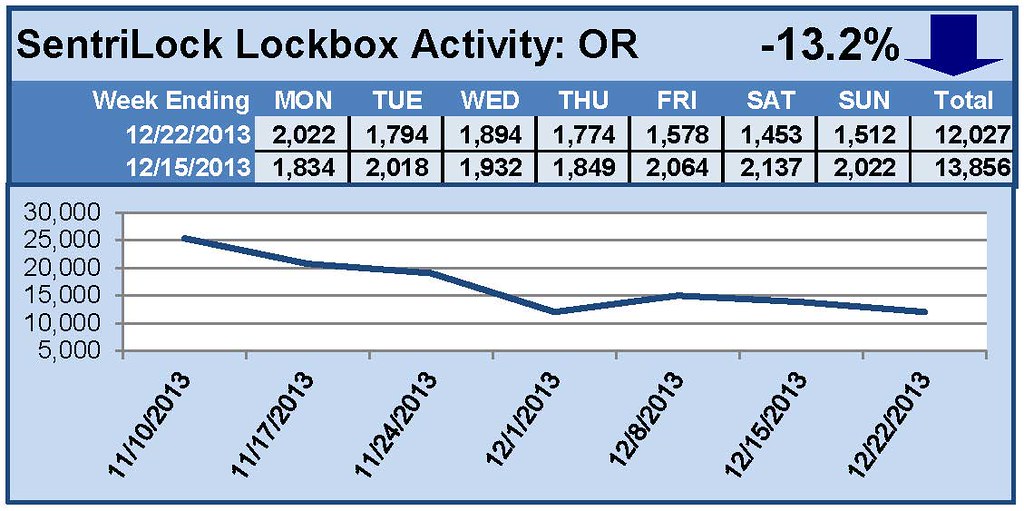
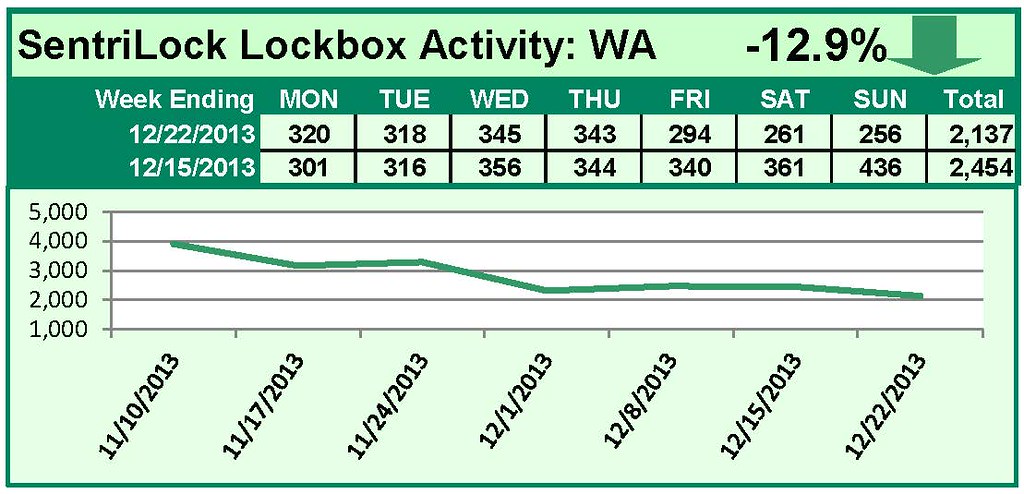
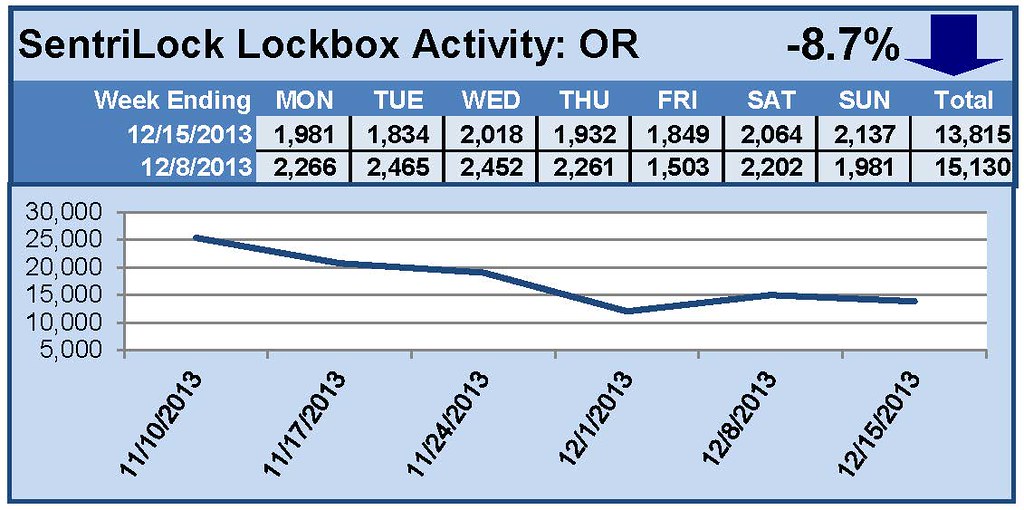
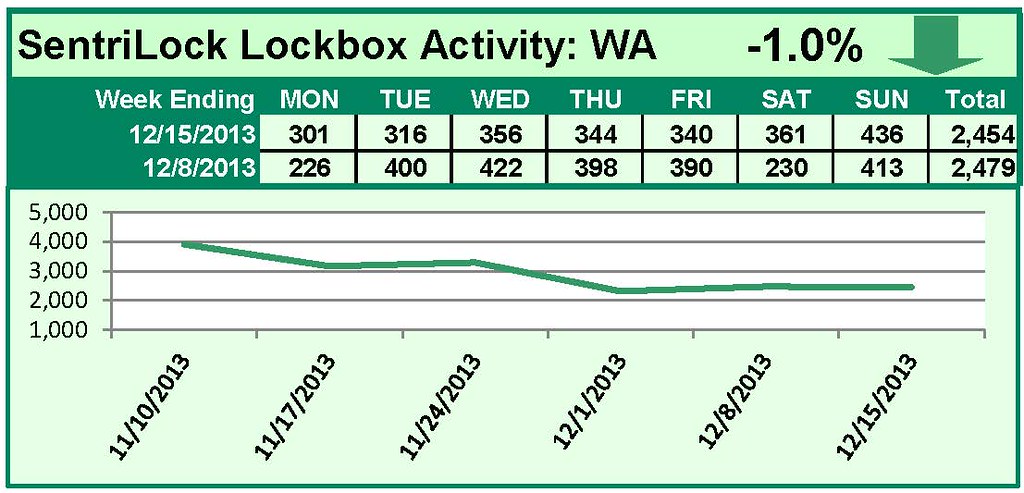
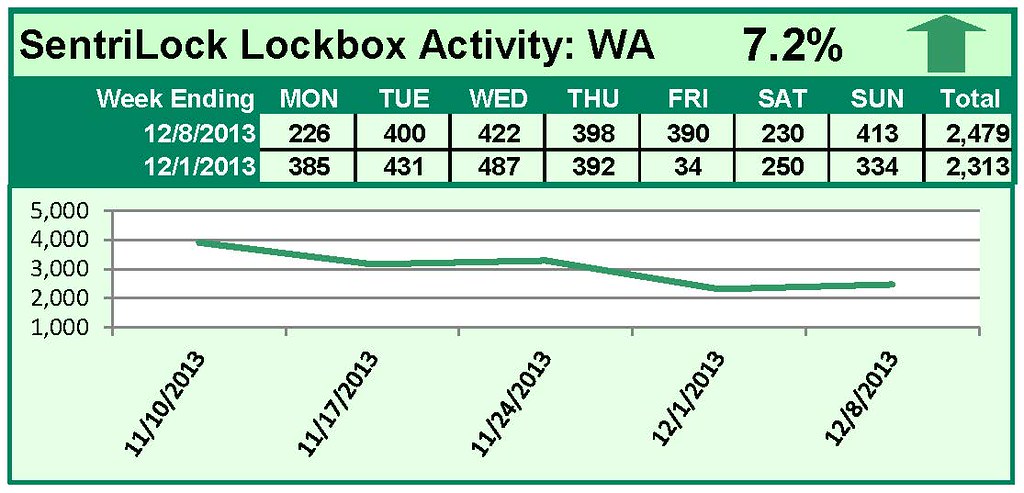
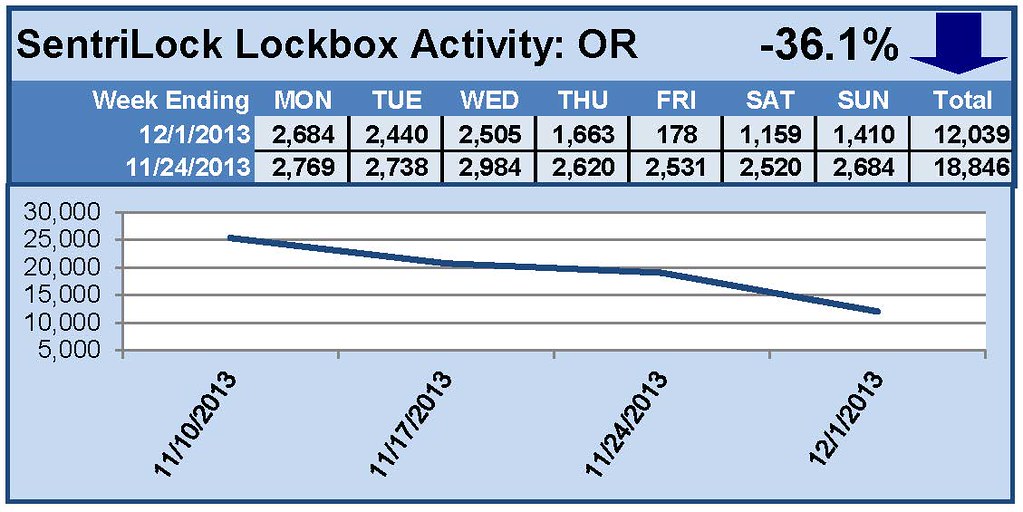
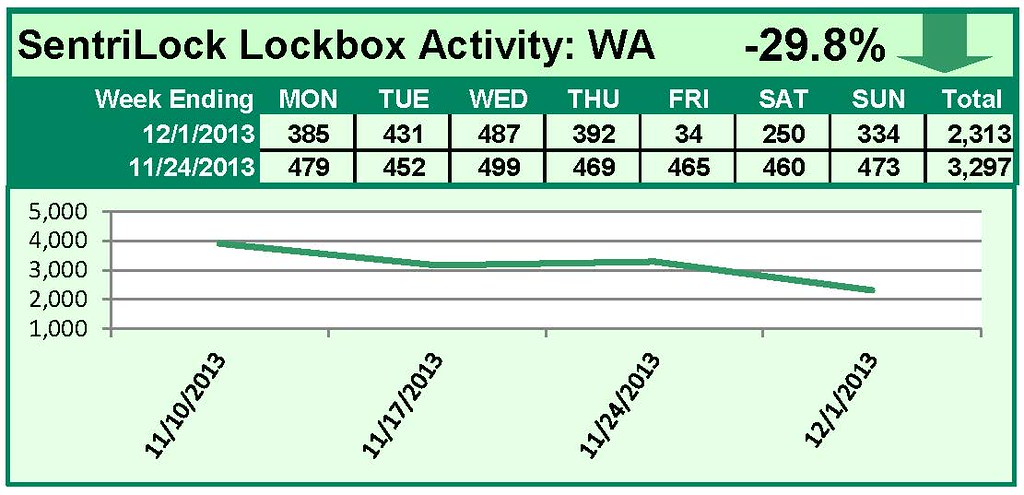
SentriLock Conversion
Number of lockboxes exchanged: 44,234

RMLS™ Subscribers
RMLS™ subscribers as of December 2013: 10,676
New RMLS™ subscribers (compared to December 2012): 497
Increase in subscribers, above: +4.9%
Subscribers who attended training: 1,857
Number of calls to the RMLS™ Help Desk: 26,119
Number of Help Desk chats: 2,564
Number of incidents reported using the “Report Issue” button: 4,155
CE hours distributed by RMLS™ at no cost to subscribers: 4,227
Total attendance at RMLS™ training events: 2,858

RMLS.com
Total customer visits to RMLS.com: 3,822,036
Unique visits: 1,110,135
Total listing views: 2,982,408

Social Media
RMLS™ followers on Facebook (December 31st): 2,472
RMLS™ followers on Twitter (December 31st): 2,000

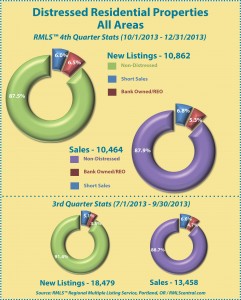
Don’t forget about the other numbers we regularly compile! In addition to publishing Market Action each month, we have statistical summaries available on RMLSweb with information dating back several years. Since 2012 we’ve also been compiling statistics about residential distressed properties in RMLSweb.

We love numbers here at RMLS™, and hope you find this data as fun and interesting as we do.


SentriLock Lockbox Activity December 23-29, 2013

This Week’s Lockbox Activity

For the week of December 23-29, 2013, these charts show the number of times RMLS™ subscribers opened SentriLock lockboxes in Oregon and Washington. Showing activity fell in both Oregon and Washington this week.

For a larger version of each chart, visit the RMLS™ photostream on Flickr.

Please note: due to the RMLS™ transition to SentriLock, historical data is only currently available through the RMLS™ Flickr page, under the tag “Supra lockbox activity.” SentriLock data will continue accumulating until each chart represents a year of data.


SentriLock Lockbox Activity December 16-22, 2013

This Week’s Lockbox Activity

For the week of December 16-22, 2013, these charts show the number of times RMLS™ subscribers opened SentriLock lockboxes in Oregon and Washington. Activity fell in both Oregon and Washington this week.

For a larger version of each chart, visit the RMLS™ photostream on Flickr.

Please note: due to the RMLS™ transition to SentriLock, historical data is only currently available through the RMLS™ Flickr page, under the tag “Supra lockbox activity.” SentriLock data will continue accumulating until each chart represents a year of data.


SentriLock Lockbox Activity December 9-15, 2013

This Week’s Lockbox Activity

For the week of December 9-15, 2013, these charts show the number of times RMLS™ subscribers opened SentriLock lockboxes in Oregon and Washington. Oregon and Washington both saw decreases in showings this week.

For a larger version of each chart, visit the RMLS™ photostream on Flickr.

Please note: due to the RMLS™ transition to SentriLock, historical data is only currently available through the RMLS™ Flickr page, under the tag “Supra lockbox activity.” SentriLock data will continue accumulating until each chart represents a year of data.


SentriLock Lockbox Activity December 2-8, 2013

This Week’s Lockbox Activity

For the week of December 2-8, 2013, these charts show the number of times RMLS™ subscribers opened SentriLock lockboxes in Oregon and Washington. Showings rose in both Oregon and Washington this week.

For a larger version of each chart, visit the RMLS™ photostream on Flickr.

Please note: due to the RMLS™ transition to SentriLock, historical data is only currently available through the RMLS™ Flickr page, under the tag “Supra lockbox activity.” SentriLock data will continue accumulating until each chart represents a year of data.


SentriLock Lockbox Activity November 25-December 1, 2013

This Week’s Lockbox Activity

For the week of November 25-December 1, 2013, these charts show the number of times RMLS™ subscribers opened SentriLock lockboxes in Oregon and Washington. Showings decreased sharply in both Oregon and Washington this week.

For a larger version of each chart, visit the RMLS™ photostream on Flickr.

Please note: due to the RMLS™ transition to SentriLock, historical data is only currently available through the RMLS™ Flickr page, under the tag “Supra lockbox activity.” SentriLock data will continue accumulating until each chart represents a year of data.