Residential Distressed Properties for Second Quarter (April-June) 2013

AllAreas2ndQDistressed

This chart shows the number of bank owned/REO properties and short sales in all areas of the RMLS™ system during the second quarter of 2013.

Below are links to additional charts for some of our larger areas.
Portland Metro Distressed Properties (2nd Quarter 2013)
Clark County, WA Distressed Properties (2nd Quarter 2013)
Lane County, OR Distressed Properties (2nd Quarter 2013)
Douglas County, OR Distressed Properties (2nd Quarter 2013)
Coos County, OR Distressed Properties (2nd Quarter 2013)

Here are some additional facts about distressed residential properties in the second quarter of 2013:

All areas when comparing percentage share of the market, second quarter 2013 to first quarter 2013:
• When comparing the second quarter 2013 to first quarter 2013, distressed sales as a percentage of new listings decreased by 6.3% (9.0% v. 15.3%).
• In a comparison of the second quarter 2013 to first quarter 2013, distressed sales as a percentage of closed sales decreased by 9.2% (15.3% v. 24.5%).
• Short sales comprised 5.7% of new listings and 8.5% of sales in the second quarter of 2013, down 3.5% and down 2.9% from the first quarter of 2013, respectively.
• Bank owned/REO properties comprised 3.3% of new listings and 6.8% of sales in the second quarter of 2013, down 2.8% and 6.3% from the first quarter of 2013, respectively.

Portland Metro when comparing percentage share of the market, second quarter 2013 to first quarter 2013:
• When comparing the second quarter 2013 to first quarter 2013, distressed sales as a percentage of new listings decreased by 5.8% (8.1% v. 13.9%).
• In a comparison of second quarter 2013 to first quarter 2013, distressed sales as a percentage of closed sales decreased by 8.8% (13.4% v. 22.2%).
• Short sales comprised 5.8% of new listings and 8.4% of sales in the second quarter of 2013, down 2.9% and 2.8% from the first quarter of 2013, respectively.
• Bank owned/REO properties comprised 2.3% of new listings and 5.0% of sales in the second quarter of 2013, down 2.9% and 6.0% from the first quarter of 2013, respectively.

Clark County when comparing percentage share of the market, second quarter 2013 to first quarter 2013:
• When comparing the second quarter 2013 to first quarter 2013, distressed sales as a percentage of new listings decreased by 7.1% (16.6% v. 23.7%).
• In a comparison of second quarter 2013 to first quarter 2013, distressed sales as a percentage of closed sales decreased by 6.3% (24.3% v. 30.6%).
• Short sales comprised 9.7% of new listings and 13.6% of sales in the second quarter of 2013, down 5.0% for new listings and 5.1% for sales when compared to the first quarter of 2013, respectively.
• Bank owned/REO properties comprised 6.9% of new listings and 10.7% of sales in the second quarter of 2013, down 2.1% and 1.2% from the first quarter of 2013, respectively.

If you’d like more information or percentages of distressed residential sales in other areas not represented by our charts, please contact us at communications@rmls.com.


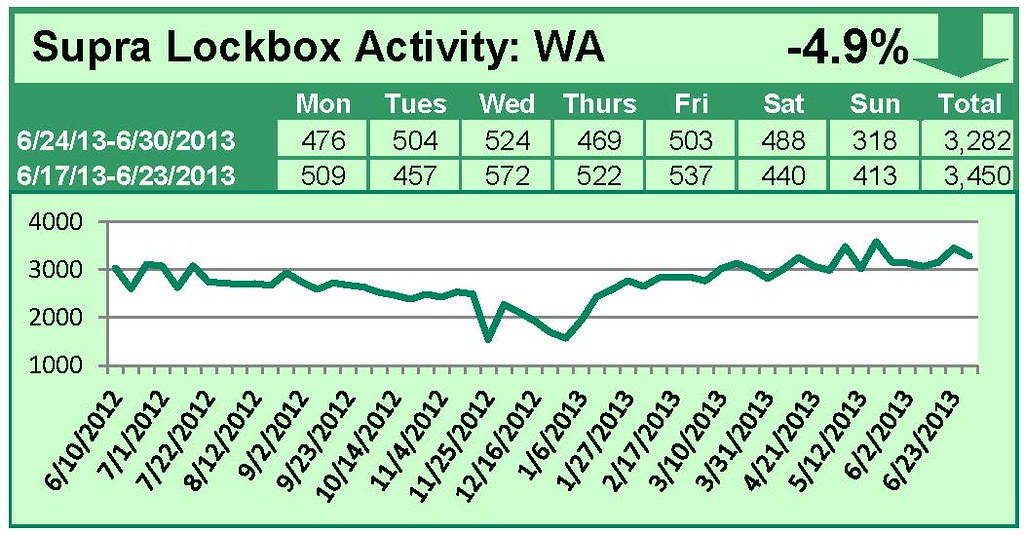
Supra Lockbox Activity July 1-7, 2013

This Week’s Lockbox Activity

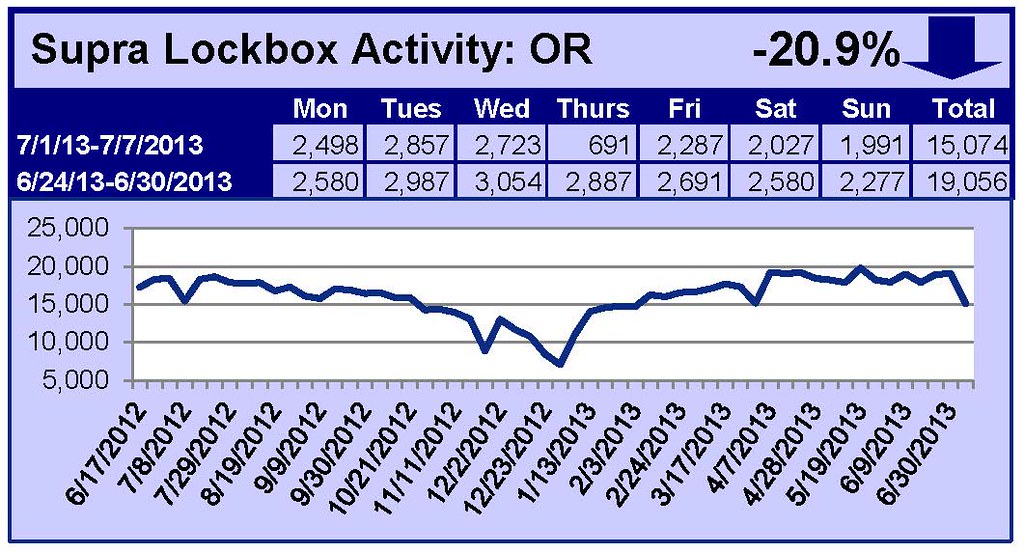
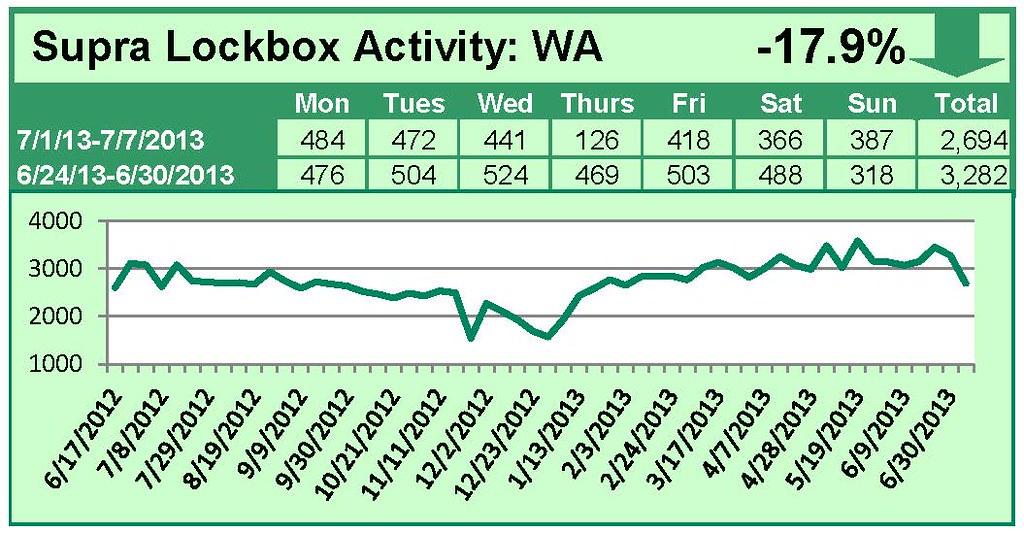
For the week of July 1-7, 2013, these charts show the number of times RMLS™ subscribers opened Supra lockboxes in Oregon and Washington. Activity in Oregon and Washington declined sharply this week.

For a larger version of each chart, visit the RMLS™ photostream on Flickr.


Supra Lockbox Activity June 24-30, 2013

This Week’s Lockbox Activity

For the week of June 24-30, 2013, these charts show the number of times RMLS™ subscribers opened Supra lockboxes in Oregon and Washington. Activity in Oregon rose slightly this week, while Washington saw a decline in showings.

For a larger version of each chart, visit the RMLS™ photostream on Flickr.


Report Issue Button a Boost for Data Accuracy

ReportIssueButton

RMLS™ subscribers got an easier way to communicate with us about data inaccuracies when the Report Issue button (above) was added to the bottom of all Agent Full reports during our RMLSweb system improvements in January.

RulesButtonReportSince it was released on January 30th, more than 2,000 issues have been reported (averaging about 400 per month)!

If you haven’t yet explored this feature, when the Report Issue button is clicked a form pops up with the listing number and other identifying information already filled in (right). There is a menu of 12 options that can be selected.

Look below to see how the options ranked in the number of reports we have received.

RulesReportsJuly2013

Other is partly a catch-all of general inquiries, but one category that comes up frequently is corrections to the Comparable Information section for sold listings. We have even received compliments for the listing agent in this category. We were thrilled to read this issue report:

Please let the listing agent know what a great job she did on this listing. All the information is there that I need to help my client.

Vallerie Bush and Wanda Kennedy make up the RMLS™ team that ensures all reported data inaccuracies get resolved, and they are enthusiastic about this boost for RMLS™ data accuracy. (In addition to responding to issues reported through the Report Issue button, they field many phone calls and emails.) Wanda says:

I have only heard good things regarding the rules button. The subscribers say it saves them so much time. When they see something wrong with a listing they can send it in right then and there. I think it was a great idea!

Vallerie adds,

It is faster and more convenient to send a rules violation to RMLS™. I like it because it usually has most of the information needed when processing.

Keep the reports coming! Accurate data helps all of our subscribers and the buyers and sellers they serve.


Supra Lockbox Activity June 17-23, 2013

This Week’s Lockbox Activity

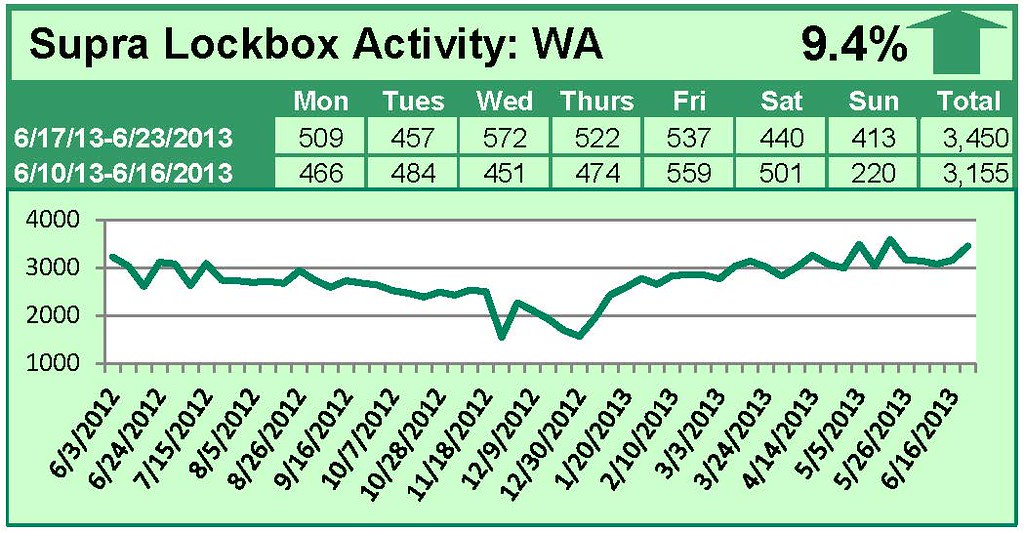
For the week of June 17-23, 2013, these charts show the number of times RMLS™ subscribers opened Supra lockboxes in Oregon and Washington. Activity in both states rose significantly this week.

For a larger version of each chart, visit the RMLS™ photostream on Flickr.


Supra Lockbox Activity June 10-16, 2013

This Week’s Lockbox Activity

For the week of June 10-16, 2013, these charts show the number of times RMLS™ subscribers opened Supra lockboxes in Oregon and Washington. Activity rose slightly in Washington, but fell in Oregon this week.

For a larger version of each chart, visit the RMLS™ photostream on Flickr.


Supra Lockbox Activity June 3-9, 2013

This Week’s Lockbox Activity

For the week of June 3-9, 2013, these charts show the number of times RMLS™ subscribers opened Supra lockboxes in Oregon and Washington. Activity rose in Oregon, but tapered slightly in Washington this week.

For a larger version of each chart, visit the RMLS™ photostream on Flickr.


Supra Lockbox Activity May 27-June 2, 2013

This Week’s Lockbox Activity

For the week of May 27-June 2, 2013, these charts show the number of times RMLS™ subscribers opened Supra lockboxes in Oregon and Washington. Activity decreased in both Oregon and Washington this week.

For a larger version of each chart, visit the RMLS™ photostream on Flickr.


Supra Lockbox Activity May 20-26, 2013

This Week’s Lockbox Activity

For the week of May 20-26, 2013, these charts show the number of times RMLS™ subscribers opened Supra lockboxes in Oregon and Washington. Activity decreased in both Oregon and Washington this week.

For a larger version of each chart, visit the RMLS™ photostream on Flickr.


Supra Lockbox Activity May 6-12, 2013

This Week’s Lockbox Activity

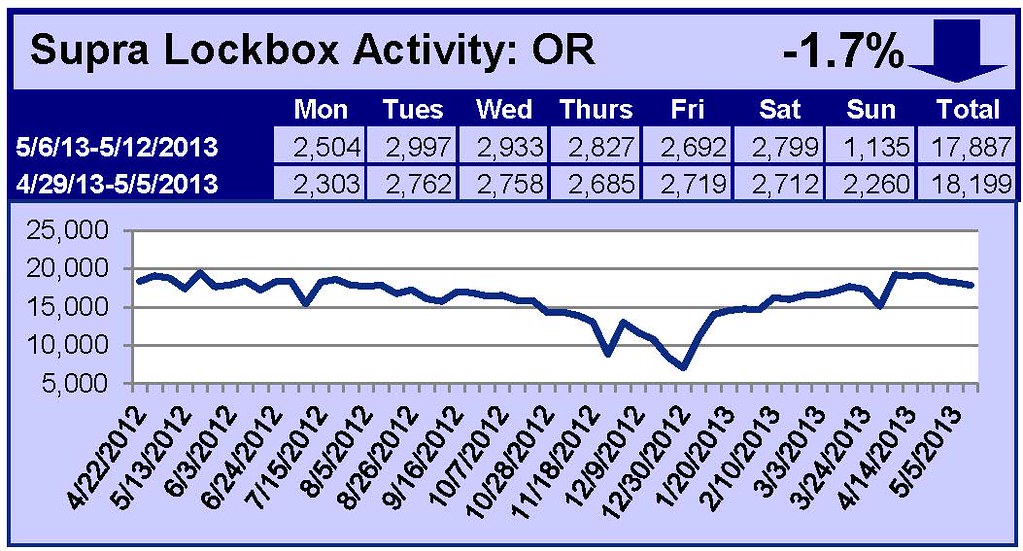
For the week of May 6-12, 2013, these charts show the number of times RMLS™ subscribers opened Supra lockboxes in Oregon and Washington. Activity fell in both Oregon and Washington this week.

For a larger version of each chart, visit the RMLS™ photostream on Flickr.