Supra Lockbox Activity – Updated Through August 2

Downward trend continues

Comparing July 20, 2009 through August 2, 2009 the number of times RMLS™ subscribers opened Supra lockboxes decreased 15% in Washington and 5.4% in Oregon.


Click the chart for a larger view (Oregon, left; Washington, right)

Archive
View an archive of the Supra lockbox statistical reports on Flickr.


Supra Lockbox Activity – Updated through July 26

Activity continues to slide, slightly

Comparing July 13, 2009 through July 26, 2009 the number of times RMLS™ subscribers opened Supra lockboxes decreased 1.4% in Washington and 1.9% in Oregon.


Click the chart for a larger view (Oregon, top; Washington, bottom)

Archive
View an archive of the Supra lockbox statistical reports on Flickr.


Supra Lockbox Activity – Updated through July 19

Activity down over previous week

Comparing July 6, 2009 through July 19, 2009 the number of times RMLS™ subscribers opened Supra lockboxes decreased 0.1% in Washington and 3.9% in Oregon.


Click the chart for a larger view (Oregon, left; Washington, right)

Archive
View an archive of the Supra lockbox statistical reports on Flickr.


How Prevalent Are Short Sales In the RMLS Market Areas?

Lots of people are talking about short sales and foreclosures these days. If you didn’t know better, you might think that they’re the dominant type of listing for sale. But fortunately, you do know better and starting next week when we add two new short sale fields to RMLSweb (more on that later)  it’s going to be even easier for you to keep tabs on these distressed properties. 

The graph below shows you the total number of active listings in RMLSweb as of today, July 23, 2009, compared with the number of active listings that are checked 3rd Party to Transaction Yes – approximately 12.8%.
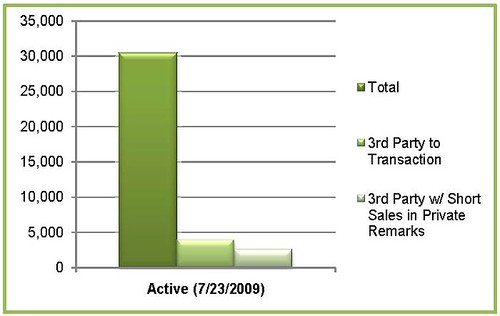
(Since 3rd Party to Transaction doesn’t necessarily mean it’s a short sale – it could also be an estate sale or relo property, for example – I’ve also included the number of 3rd Party to Transaction that mention short sale in the Private Remarks.)

The next logical question is how well are these properties selling? To help answer that here’s another chart that shows the number of listings marked 3rd Party to Transaction Yes that are currently active , currently pending and  that sold in the first half of the year.


As I mentioned earlier, 3rd Party to Transaction Yes does not necessarily mean a listing is a short sale. Therefore, to handle short sales more efficiently and to help the other types of properties that require 3rd Party approval to get fair attention, the RMLS™ Board of directors voted to add the following fields to RMLSweb:

Short Sale Yes/No – will be required when entering a listing and 3rd Party to Transaction will be automatically checked when Yes is selected.

Short Sale Offer (Seller Accepted; Submitted for Approval) Yes/No – The rules will be revised to require updating this field when an offer is made.

For more information on short sales see the National Association of Realtors Field Guide to Short Sales.

P.S. Be sure to check back for statistics on Bank Owned properties to come soon.


Supra Lockbox Activity – Updated through July 12: Back Up After Holiday

While, the number of lockboxes that were accessed dipped during the week of the 4th of July, they seem to have rebounded nicely. Comparing June 29, 2009 through July 12, 2009 the number of times RMLS™ subscribers opened Supra lockboxes increased 23.9% in Washington and 21.9% in Oregon.


Click the chart for a larger view (Oregon, left; Washington, right)

Archive
View an archive of the Supra lockbox statistical reports on Flickr.


June 2009 RMLS Market Action Shows Positive Activity in Several Areas in Oregon & Southern Washington

The latest issue of the RMLS™ Market Action for June 2009 shows increases in accepted offers, closed sales and a decrease in inventory in several regions.

Accepted Offers
The five county Portland Metro Area saw a month-over-month increase in pending sales (8.4% comparing June 2009 with June 2008) for the first time since December 2006. Pending sales also increased for the third month in a row in Clark County, Washington. The following regions also saw an increase in pending listings in June 2009: Coos, Curry, Douglas, Lane, Mid-Columbia and Union.

Closed Sales
Closed sales in Clark County increased14.8% comparing June 2009 with June 2008.  This is the first increase since September 2008.

The following regions also experienced increases in closed sales: Columbia Basin, Curry, Douglas and Mid-Columbia.

Inventory
Inventory in all three of our largest service areas (Portland Metro, Clark County and Lane County) dipped to the lowest it’s been since August 2007. In addition, the following counties experienced drops in inventory from the previous month: Columbia Basin, Coos, Curry and Douglas.


Supra Lockbox Activity through July 5: Down Over Holiday Weekend

Far fewer lockboxes were accessed over the 4th of July weekend than on a typical Saturday or Sunday. Therefore, comparing June 22, 2009 through July 5, 2009 the number of times RMLS™ subscribers opened Supra lockboxes decreased 21.4% in Washington and 21.9% in Oregon.


Click the chart for a larger view (Oregon, left; Washington, right)

Archive
View an archive of the Supra lockbox statistical reports on Flickr.


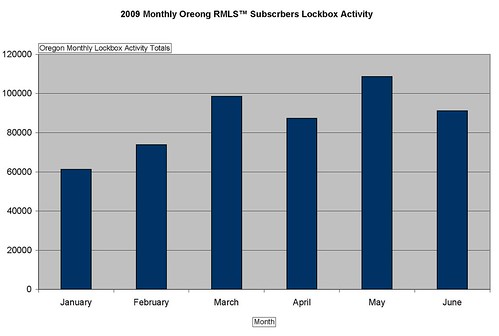
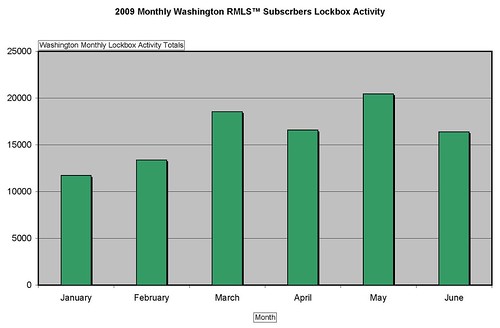
Lockbox Activity – Halfway Through 2009

As you know, we’ve been tracking the number of times RMLS™ subscribers open Supra lockboxes in Oregon and Washington. Here’s how it looks mid-way through 2009.

In Oregon, May was the high point with nearly 109,000 opens. For the year so far, total, there were 520,900 lockbox opens.

The same held true in Southern Washington, as May was tops with over 20,000 opens. The total for the year so far was 97,100 lockbox opens.

These numbers should be interesting to watch as we head into the typically hot summer months of July and August. Follow all the latest lockbox activity on our Flickr page.


Supra Lockbox Stats – Updated Through 6-28

Comparing Supra lockbox openings by RMLS™ subscribers between June 15, 2009 and June 28, 2009 there was a 7.7% increase in Oregon and a 1.4% increase in Washington from the previous week.


Click the chart for a larger view (Oregon, left; Washington, right)


Supra Lockbox Stats Through 6-7-2009 Up Again From Previous Week

The latest information from Supra shows lockbox openings were up from the previous week in Oregon and Washington.