Supra Lockbox Activity – Updated through July 26

Activity continues to slide, slightly

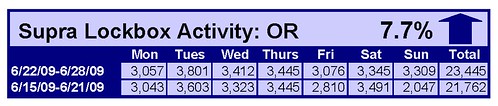
Comparing July 13, 2009 through July 26, 2009 the number of times RMLS™ subscribers opened Supra lockboxes decreased 1.4% in Washington and 1.9% in Oregon.


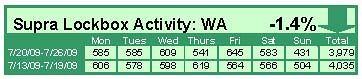
Click the chart for a larger view (Oregon, top; Washington, bottom)

Archive
View an archive of the Supra lockbox statistical reports on Flickr.


Supra Lockbox Activity – Updated through July 12: Back Up After Holiday

While, the number of lockboxes that were accessed dipped during the week of the 4th of July, they seem to have rebounded nicely. Comparing June 29, 2009 through July 12, 2009 the number of times RMLS™ subscribers opened Supra lockboxes increased 23.9% in Washington and 21.9% in Oregon.


Click the chart for a larger view (Oregon, left; Washington, right)

Archive
View an archive of the Supra lockbox statistical reports on Flickr.


Supra Lockbox Activity through July 5: Down Over Holiday Weekend

Far fewer lockboxes were accessed over the 4th of July weekend than on a typical Saturday or Sunday. Therefore, comparing June 22, 2009 through July 5, 2009 the number of times RMLS™ subscribers opened Supra lockboxes decreased 21.4% in Washington and 21.9% in Oregon.


Click the chart for a larger view (Oregon, left; Washington, right)

Archive
View an archive of the Supra lockbox statistical reports on Flickr.


Lockbox Activity – Halfway Through 2009

As you know, we’ve been tracking the number of times RMLS™ subscribers open Supra lockboxes in Oregon and Washington. Here’s how it looks mid-way through 2009.

In Oregon, May was the high point with nearly 109,000 opens. For the year so far, total, there were 520,900 lockbox opens.

The same held true in Southern Washington, as May was tops with over 20,000 opens. The total for the year so far was 97,100 lockbox opens.

These numbers should be interesting to watch as we head into the typically hot summer months of July and August. Follow all the latest lockbox activity on our Flickr page.


Supra Lockbox Stats – Updated Through 6-28

Comparing Supra lockbox openings by RMLS™ subscribers between June 15, 2009 and June 28, 2009 there was a 7.7% increase in Oregon and a 1.4% increase in Washington from the previous week.


Click the chart for a larger view (Oregon, left; Washington, right)


More New Stats

We know you’re curious how the market is doing. We are too! We’re guessing that you’ve probably had buyers asking if “we’ve hit the bottom yet” and sellers asking you how much longer it will take to sell their house. We don’t have a crystal ball, but we’ve been trying to provide you with more information to help you answer your clients’ questions.

 You may have noticed Supra lockbox access graphs and charts. These stats should give you a sense of how many lockboxes are opened on a daily and weekly basis. Plus, we’ve added a graph to show you how that activity has changed through 2009.

 Today, we’re releasing some brand new information: the number of new saved searches and the number of new prospects by RMLS™ subscribers per week since January 1! We hope these stats will be useful in helping you get an idea of when new buyers are joining the house hunt.

Saved Searches 5-24-2009

Saved Searches 5-24-2009

New Prospects 5-24-2009

New Prospects 5-24-2009

We welcome your ideas of other stats you think might be useful. We can’t promise that we’ll be able to gather them for you, but we will try to incorporate those ideas whenever we can.