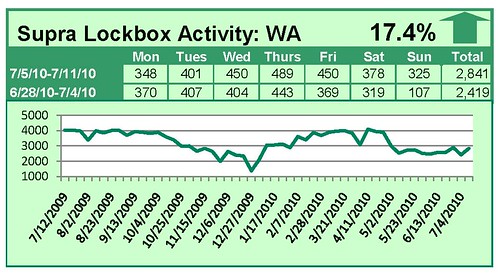
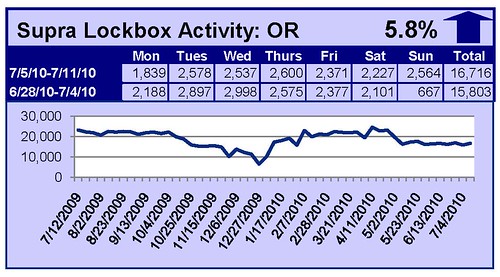
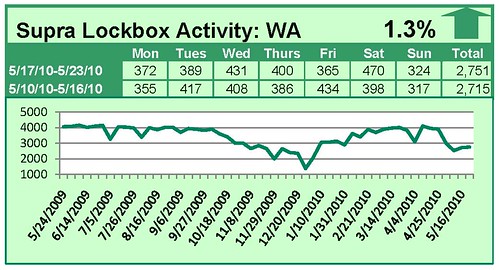
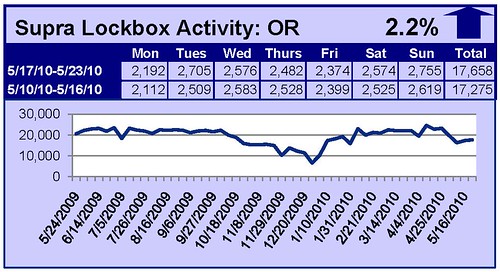
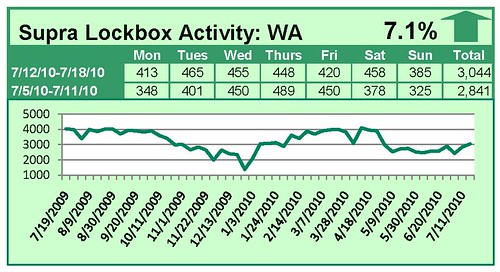
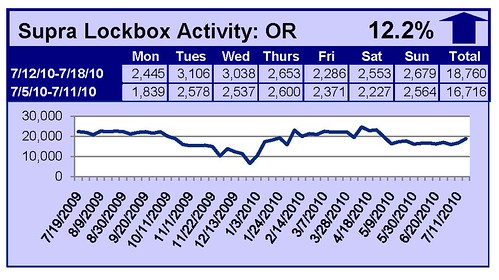
Supra Lockbox Activity – Updated Through Week of July 12-18

Both states see activity gains from previous week

When comparing the week of July 12 – July 18 with the week prior, the number of times an RMLS™ subscriber opened a Supra lockbox increased 7.1% in Washington and 12.2% in Oregon.


Archive

View an archive of the Supra lockbox statistical reports on Flickr.


Supra Lockbox Activity – Updated Through Week of July 5 – 11

Activity back up after holiday drop

When comparing the week of July 5 – July 11 with the week prior, the number of times an RMLS™ subscriber opened a Supra lockbox increased 17.4% in Washington and 5.8% in Oregon.


Archive
View an archive of the Supra lockbox statistical reports on Flickr.


Supra Lockbox Activity – Updated Through June 21 – June 27

Activity rises in both Washington and Oregon

When comparing the week of June 21 – June 27 with the week prior, the number of times an RMLS™ subscriber opened a Supra lockbox increased 12.2% in Washington and increased 4.9% in Oregon.


Click the chart for a larger view
Archive

View an archive of the Supra lockbox statistical reports on Flickr.


Supra Lockbox Activity – Updated Through Week of June 14 – 20

Activity numbers show slight changes

When comparing the week of June 14 – June 20 with the week prior, the number of times an RMLS™ subscriber opened a Supra lockbox increased 0.1% in Washington and decreased 2.9% in Oregon.

Click the chart for a larger view

Archive

View an archive of the Supra lockbox statistical reports on Flickr.


Supra Lockbox Activity – Updated Through Week of June 7 – 13

Activity numbers up in both states

When comparing the week of June 7 – June 13 with the week prior, the number of times an RMLS™ subscriber opened a Supra lockbox increased 4.7% in Washington and increased 1.1% in Oregon.


Click the chart for a larger view

Archive

View an archive of the Supra lockbox statistical reports on Flickr.


Supra Lockbox Activity – Updated Through Week of May 24 – 30

Activity takes a downward turn in Washington and Oregon

When comparing the week of May 24 – May 30 with the week prior, the number of times an RMLS™ subscriber opened a Supra lockbox decreased 8.4% in Washington and decreased 8.8% in Oregon.


Click the chart for a larger view

Archive

View an archive of the Supra lockbox statistical reports on Flickr.


Supra Lockbox Activity – Updated Through Week of May 17-23

Activity rises again in both states

When comparing the week of May 17 – May 23 with the week prior, the number of times an RMLS™ subscriber opened a Supra lockbox increased 1.3% in Washington and increased 2.2% in Oregon.


Click the chart for a larger view

Archive

View an archive of the Supra lockbox statistical reports on Flickr.


Supra Lockbox Activity – Updated Through Week of May 10 – 16

Activity increases in both Washington and Oregon

When comparing the week of May 10 – May 16 with the week prior, the number of times an RMLS™ subscriber opened a Supra lockbox increased 7.6% in Washington and increased 6.4% in Oregon.


Click the chart for a larger view

Archive
View an archive of the Supra lockbox statistical reports on Flickr.


Supra Lockbox Activity – Updated Through Week of May 3 – 9

Both states show decreases in activity

When comparing the week of May 3 – May 9 with the week prior, the number of times an RMLS™ subscriber opened a Supra lockbox decreased 15.6% in Washington and decreased 17.3% in Oregon.


Click the chart for a larger view

Archive

View an archive of the Supra lockbox statistical reports on Flickr.


Supra Lockbox Activity – Updated Through Week of April 26 – May 2

Both states show decreases in activity

When comparing the week of April 26 – May 2 with the week prior, the number of times an RMLS™ subscriber opened a Supra lockbox decreased 23.4% in Washington and decreased 15.2% in Oregon.


Click the chart for a larger view

Archive

View an archive of the Supra lockbox statistical reports on Flickr.