Supra Lockbox Activity September 9-15, 2013

This Week’s Lockbox Activity

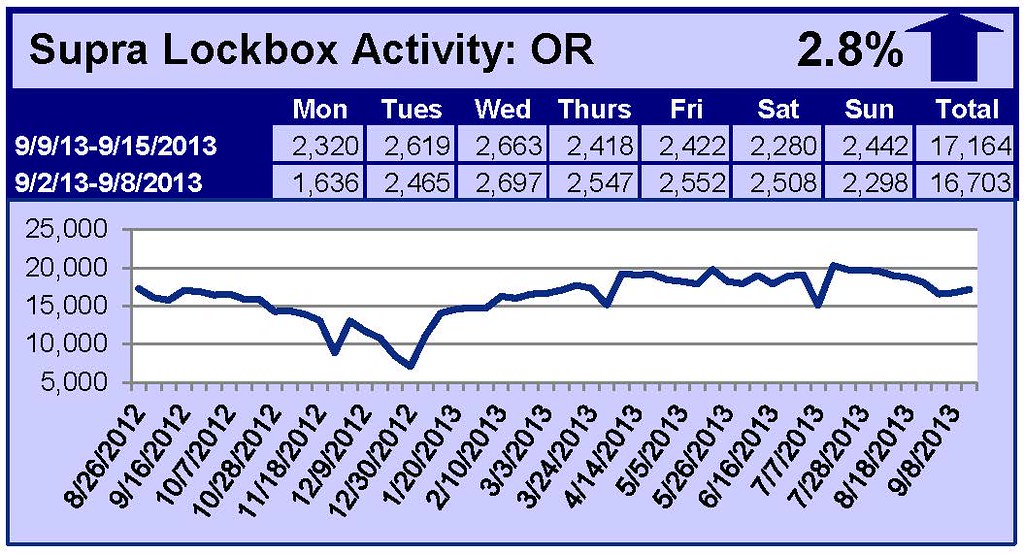
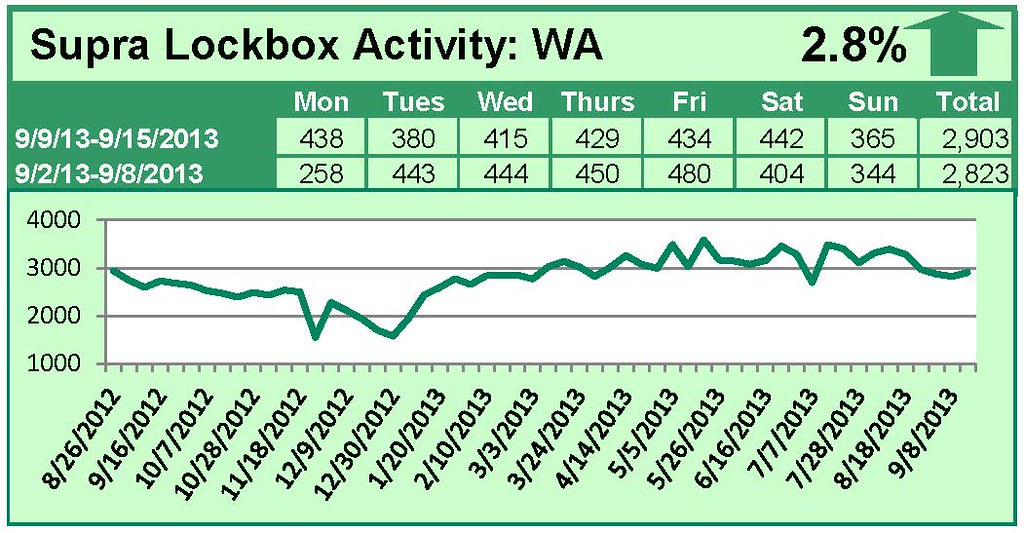
For the week of September 9-15, 2013, these charts show the number of times RMLS™ subscribers opened Supra lockboxes in Oregon and Washington. Showings increased in both Oregon and Washington by 2.8% this week.

For a larger version of each chart, visit the RMLS™ photostream on Flickr.


Supra Lockbox Activity September 2-8, 2013

This Week’s Lockbox Activity

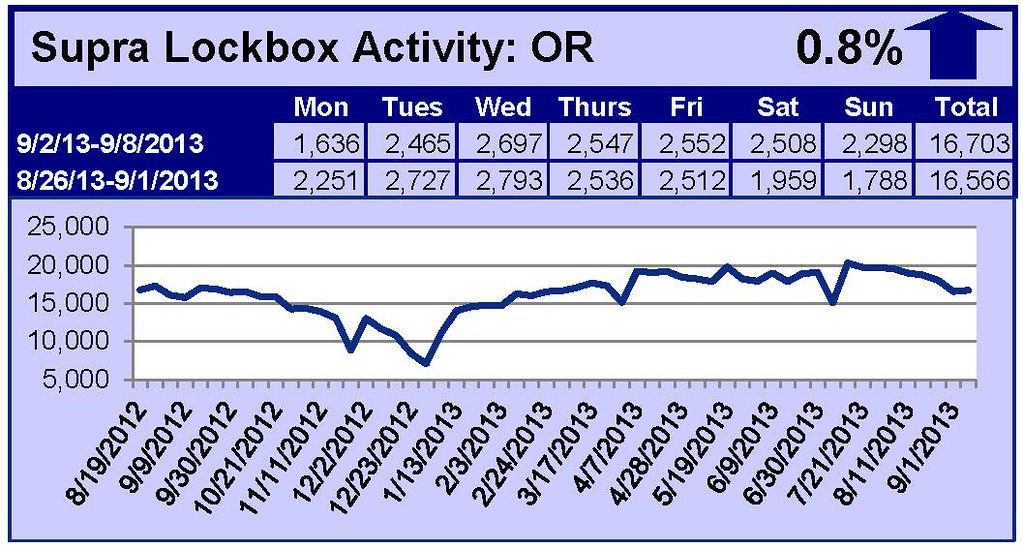
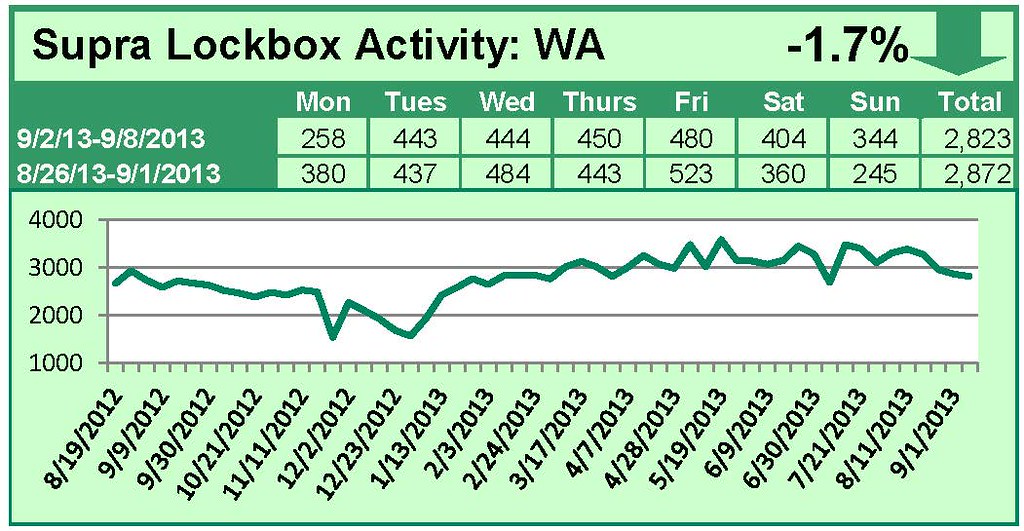
For the week of September 2-8, 2013, these charts show the number of times RMLS™ subscribers opened Supra lockboxes in Oregon and Washington. Showings decreased Washington but increased slightly in Oregon this week.

For a larger version of each chart, visit the RMLS™ photostream on Flickr.


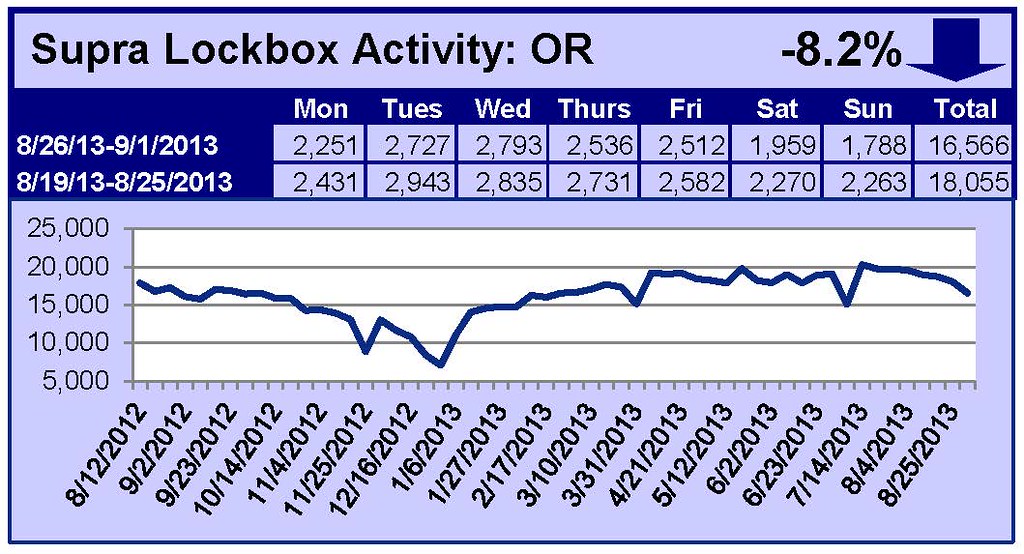
Supra Lockbox Activity August 26-September 1, 2013

This Week’s Lockbox Activity

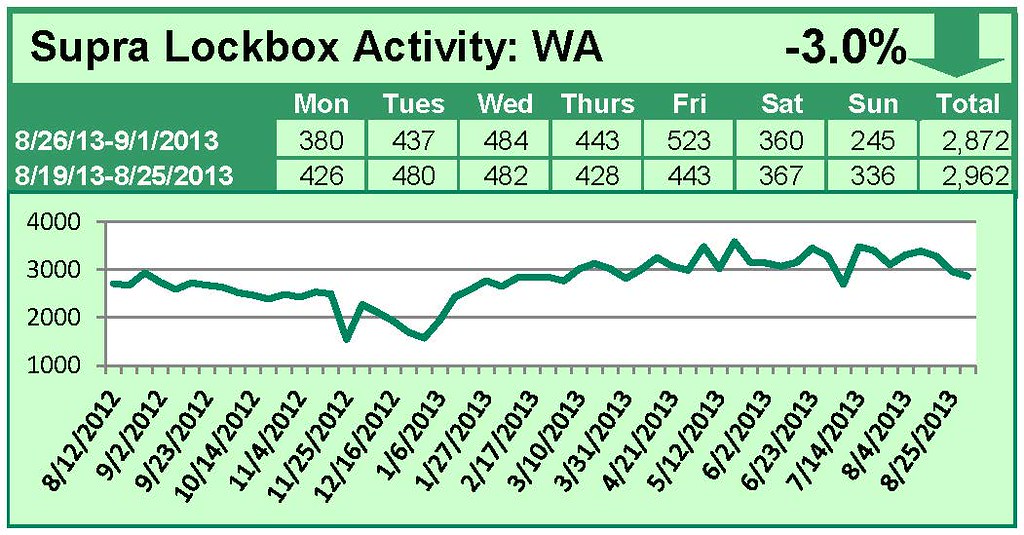
For the week of August 26-September 1, 2013, these charts show the number of times RMLS™ subscribers opened Supra lockboxes in Oregon and Washington. Showings decreased in both Oregon and Washington this week.

For a larger version of each chart, visit the RMLS™ photostream on Flickr.


2.3 Million Public Records and Counting: Tax Information on RMLSweb

Oregon Washington 1-31-13RMLS™ strives to provide property and tax data in one location for all counties where our subscribers do business. Currently RMLS™ maintains over 2.3 million property records encompassing 43 counties in Oregon and Washington.

Each county has its own assessor and its own system for maintaining property and tax records. Many systems are one of a kind—one county system still uses 3×5 cards! Although some counties provide a website where individual tax properties can be researched, many counties do not provide such convenient access.

RMLS™ obtains data from the county itself or from another tax provider and then processes it into a standard RMLS™ format. The data is quality checked to the best extent possible. Updated property and tax data is then deployed to RMLSweb each week on Tuesday evening.

Depending on availability and other factors, sales are updated either weekly, quarterly, or biannually. Some counties do not provide sale data at all. It is important to remember that regardless of the update schedule, RMLS™ data will always lag a little compared to data from the county itself. This is especially true of tax amounts due to the volume of processing required.

Along with a defined primary set of property data (tax ID, acres, site address, market values, sales data, etc.) each county also has a unique set of ancillary data (heating, foundation, parking, etc.). Each data item also has a “fill factor” unique to each county. For example, in Baker County 98% of properties have a zoning value, in Jackson it is 83%, in Tillamook it is 72%, and in Benton it is 0%. RMLS™ analyzes these data items and factors and then displays the most relevant data on the tax report. Every county’s tax report is therefore slightly different.

The property and tax data also contains errors and omissions. Humans, computers, and governments are involved in the process and mistakes do occur. Whenever a subscriber encounters such a situation, they should contact us (you can reach me at kim.h@rmls.com) and provide sufficient details (county, tax ID, description of error) so that research can be done and the proper correction made. Most cases are resolved with the next update from the county. In the meantime, subscribers are advised to put a comment about any tax issues into the listing’s private remarks field.
Supra Lockbox Activity August 19-25, 2013

This Week’s Lockbox Activity

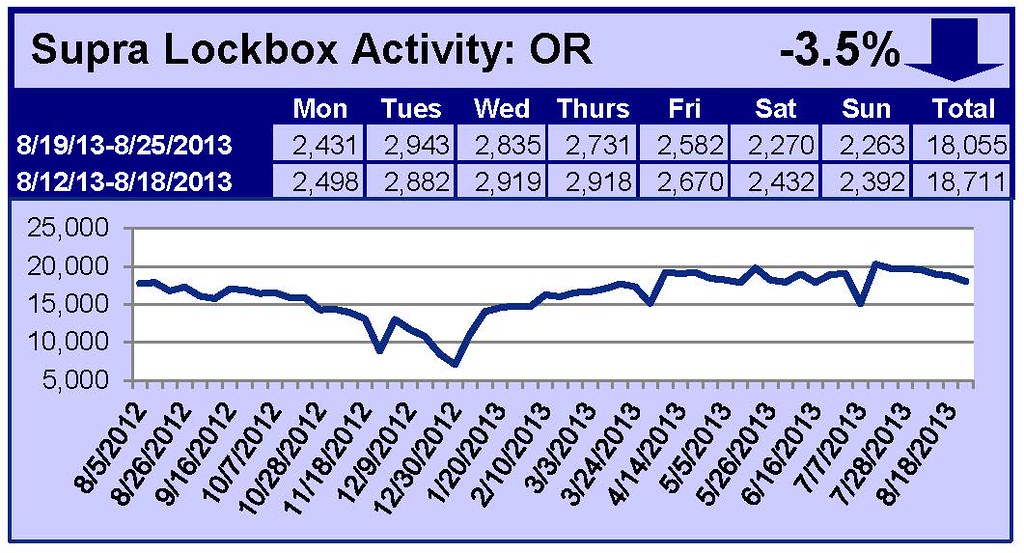
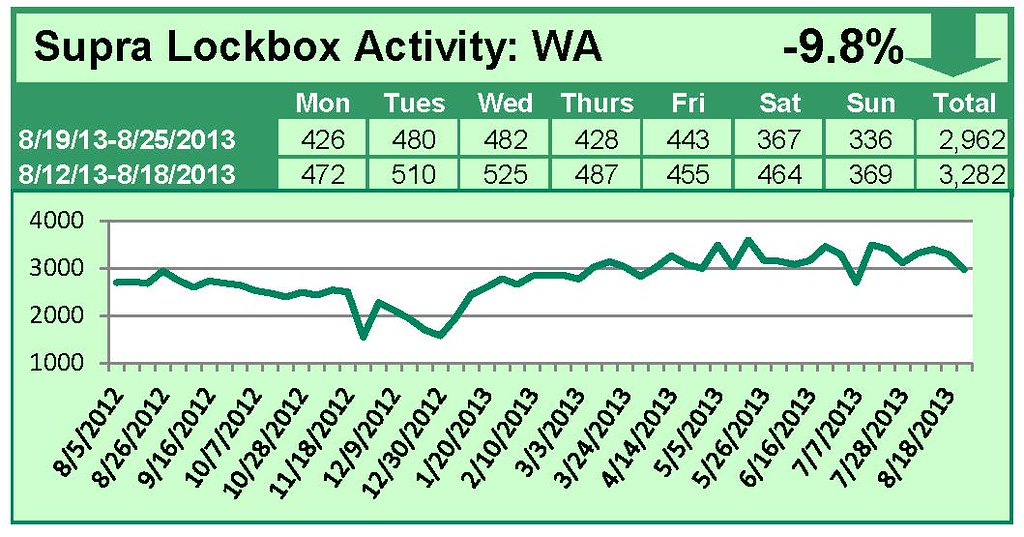
For the week of August 19-25, 2013, these charts show the number of times RMLS™ subscribers opened Supra lockboxes in Oregon and Washington. Showings decreased in both Oregon and Washington this week.

For a larger version of each chart, visit the RMLS™ photostream on Flickr.


Supra Lockbox Activity August 12-18, 2013

This Week’s Lockbox Activity

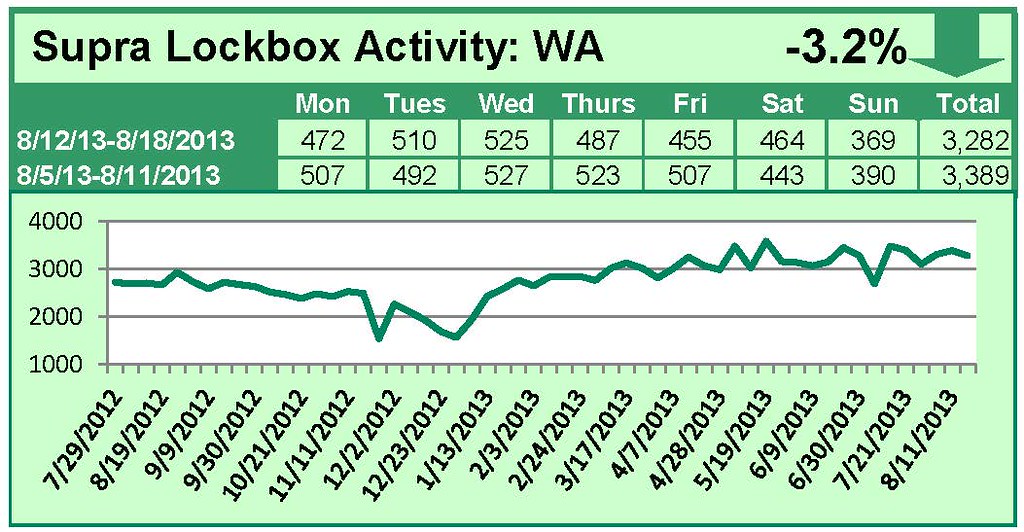
For the week of August 12-18, 2013, these charts show the number of times RMLS™ subscribers opened Supra lockboxes in Oregon and Washington. Activity decreased in both Oregon and Washington this week.

For a larger version of each chart, visit the RMLS™ photostream on Flickr.


Supra Lockbox Activity August 5-11, 2013

This Week’s Lockbox Activity

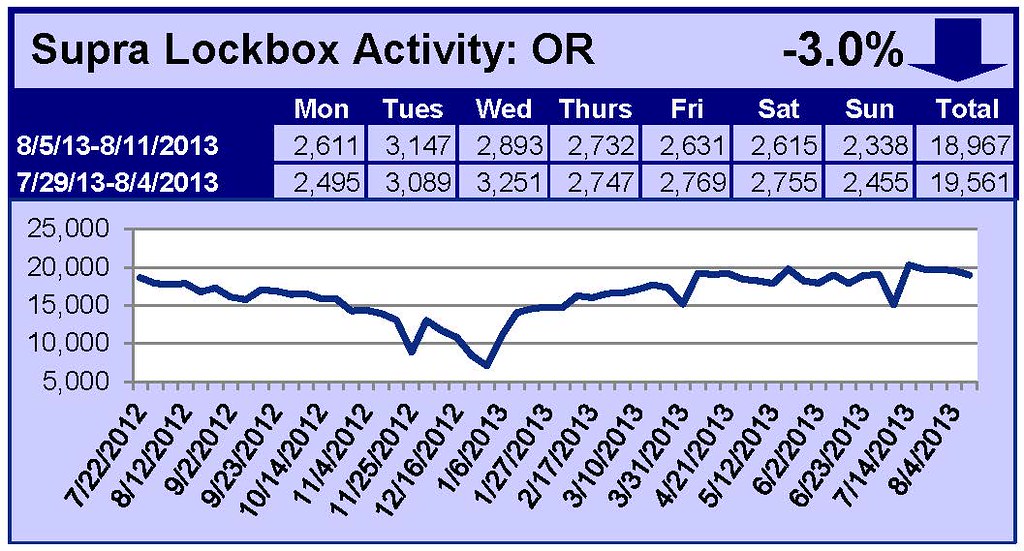
For the week of August 5-11, 2013, these charts show the number of times RMLS™ subscribers opened Supra lockboxes in Oregon and Washington. Showings in Oregon decreased this week, while activity in Washington increased.

For a larger version of each chart, visit the RMLS™ photostream on Flickr.


Supra Lockbox Activity July 29-August 4, 2013

This Week’s Lockbox Activity

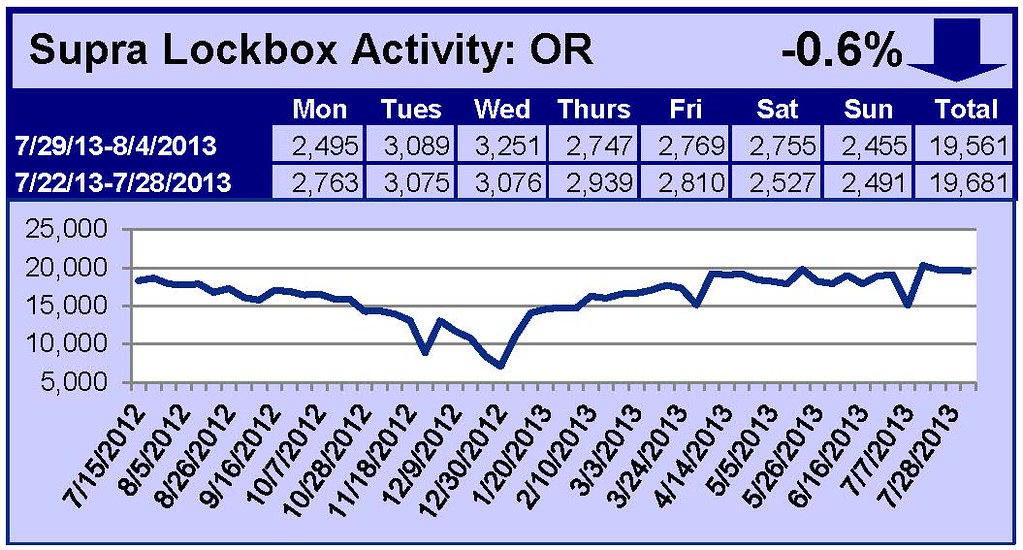
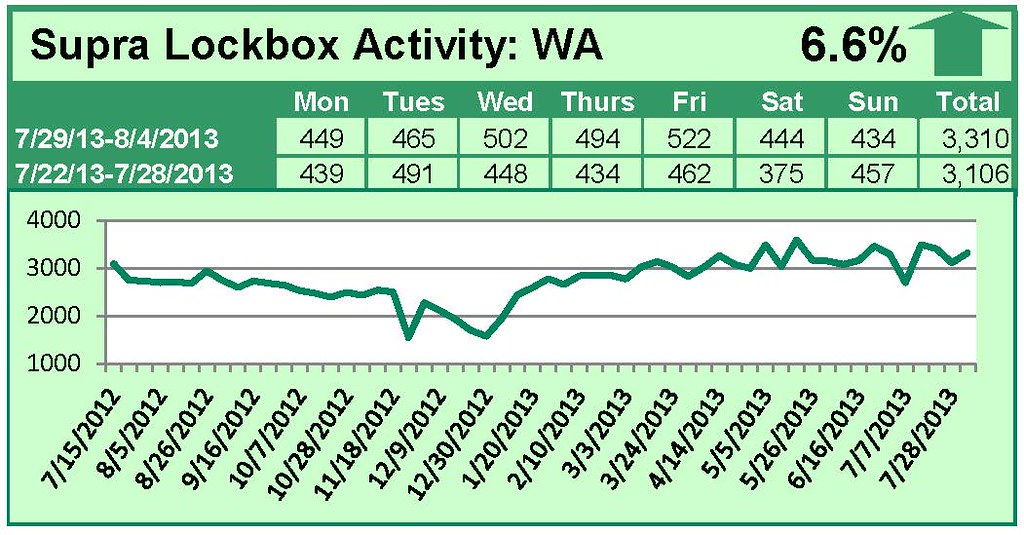
For the week of July 29-August 4, 2013, these charts show the number of times RMLS™ subscribers opened Supra lockboxes in Oregon and Washington. Activity in Washington increased this week while activity in Oregon decreased slightly.

For a larger version of each chart, visit the RMLS™ photostream on Flickr.


Supra Lockbox Activity July 22-28, 2013

This Week’s Lockbox Activity

For the week of July 22-28, 2013, these charts show the number of times RMLS™ subscribers opened Supra lockboxes in Oregon and Washington. Activity in Oregon and Washington decreased this week.

For a larger version of each chart, visit the RMLS™ photostream on Flickr.


Supra Lockbox Activity July 15-21, 2013

This Week’s Lockbox Activity

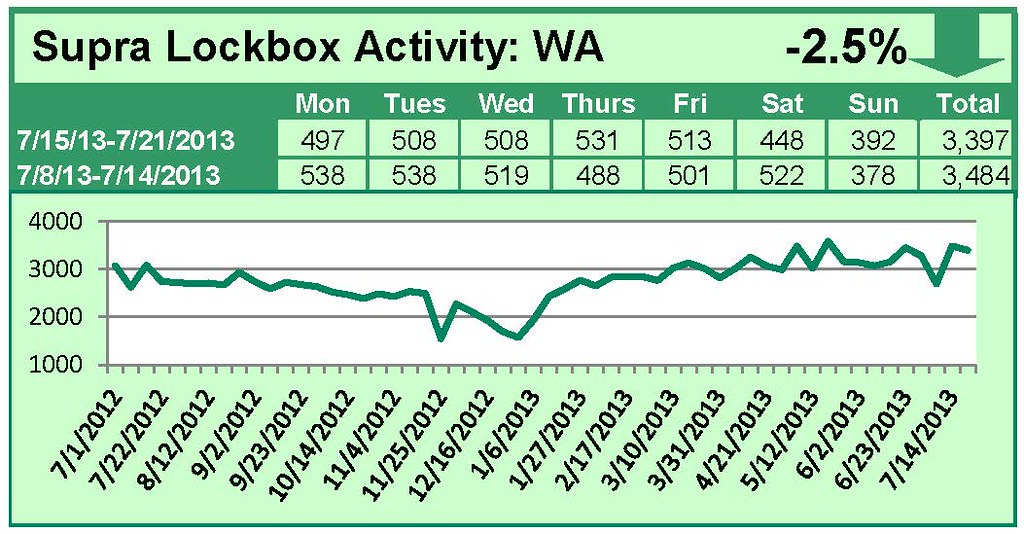
For the week of July 15-21, 2013, these charts show the number of times RMLS™ subscribers opened Supra lockboxes in Oregon and Washington. Activity in Oregon and Washington decreased this week.

For a larger version of each chart, visit the RMLS™ photostream on Flickr.