![Extreme RMLSweb Makeover: Statistics]()
by RMLS Communication Department | Feb 25, 2010
New statistics menu makes spotting market trends easier
You may have noticed that the Statistical Reports in RMLSweb recently got a facelift and moved to a new location on the NavBar. But what does this mean for your business? Here are three ways that you can use these new reports to answer real world questions:
Price Reductions – You just got a new listing and you’re excited, but you’re discovering that the seller’s expectations of how much the property will sell for are a little unrealistic and you’re not sure how to talk them down. Their neighbor sold the ir house for $385,000 this time last year and it’s only a 3 bedroom, 2 bath. Because your sellers have a 3 bedroom, 3 bathroom house they’re convinced that it should sell for at least $400,000, but you know the market has changed in a year and homes aren’t selling for as much as they were back then. Unfortunately, they’re not taking your word for it. Try running a Market Trends report for 12 months back in that MLS area, which will provide you with charts and data about how the average price has changed during the last year.
Foreclosures & Short Sales – With the changing economy, the question on everyone’s mind these days is, “How do short sales and foreclosures perform in today’s market?” With Advanced Search you can search by Bank Owned Yes to find out how many foreclosures sold last year in your market or Short Sale Yes to find out how many active listings in your area are short sales. Be sure to check Show Summary on the Search Results page and then scroll to the bottom of the page to get some additional statistics about your results, such as CDOM (for SLD statuses only), Average Price and Average SQFT.
Understanding F inancing Trends – Through your conversations with buyers you get the sense that the types of financing they are using today seems to be changing, but you’re looking for some data to back up your hunch. Look no further, because running our Market Stats Comparable Summary report can tell you this information.
We would love to hear how you utilize these tools in your day-to-day business. Feel free to leave a comment below. To schedule a training session on this new release, call your local RMLS™ office, or e-mail training@rmls.com.
by RMLS Communication Department | Feb 22, 2010
Back up from previous week
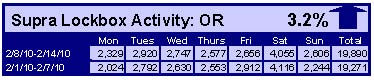
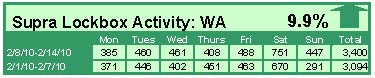
When comparing the week of February 8-14 with the week prior, the number of times an RMLS™ subscriber opened a Supra lockbox increased 9.9% in Washington and 3.2% in Oregon.

Click the chart for a larger view
Archive
View an archive of the Supra lockbox statistical reports on Flickr.
by RMLS Communication Department | Feb 19, 2010
January 2010 outperforms January 2009, but inventory still climbs
Despite the fact that closed and pending sales were up significantly when comparing January 2010 to January 2009 in most of our Market Action service areas, inventory also climbed significantly compared to the previous month. This is most likely due to the fact that new listings increased and closed sales decreased in most areas when comparing January 2010 with December 2009.
Portland saw a 34.7% increase in closed sales this month and a 24.3% increase in pending listings, while Clark County closed sales were up 34.8%, and pending sales rose 20.2%. Coos County, Douglas County, Lane County, the Mid-Columbia region and Union County also saw both closed and pending sales increase over last December.
Inventory Increase
Inventory jumped significantly in all areas in January 2010. In many of the areas this may be due to lower sales totals and higher numbers of new listings when compared to last. Portland increased from 7.7 months to 12.6 months. Clark County also entered the double digits, going from 7.6 months to 12.4. In addition, Lane County went from 7.1 months to 14.1 months. Keep in mind that this is pretty typically behavior in January.
Price Change
Average and Median sale prices continue to decline when compared to last year, in Portland, 5% and 4% respectively. But in Clark County prices are actually rose, 4.2% and 5.5% respectively. In addition, Clark County average and median sales prices increased when compared to December 2009, 0.3% and 3.9% respectively
by RMLS Communication Department | Feb 15, 2010
Activity drops in Oregon & Washington for first time in weeks
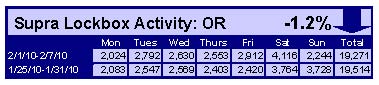
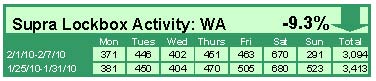
When comparing the week of February 1-7 with the week prior, the number of times an RMLS™ subscriber opened a Supra lockbox decreased 9.3% in Washington and 1.2% in Oregon.

Click the chart for a larger view
Archive
View an archive of the Supra lockbox statistical reports on Flickr.
by RMLS Communication Department | Feb 11, 2010
New statistics menu makes spotting market trends easier
The RMLSweb statistical reports have moved from their previous location under Toolkit to a new Statistics menu on the navigation bar between Prospecting and Realtor Info.
In addition we have rewritten the Market Trends, Market Stats and Inventory reports to improve the searching and results of these reports. For example, Market Trends Report will now allow you to search up to 36 months back and will provide you with inventory accumulation and sale price percent change calculations.
Click the following links for more information about our enhancements to RMLSweb Statistics:
Statistics 101 – Establish Yourself As an Expert.
RMLSweb Statistical Calculations Definitions – The RMLS™ Guide to what statistics are captured and how they’re defined.
Want a trainer to come out to your office and demonstrate this enhanced functionality? Call your local RMLS™ office or e-mail training@rmls.com.
 ir house for $385,000 this time last year and it’s only a 3 bedroom, 2 bath. Because your sellers have a 3 bedroom, 3 bathroom house they’re convinced that it should sell for at least $400,000, but you know the market has changed in a year and homes aren’t selling for as much as they were back then. Unfortunately, they’re not taking your word for it. Try running a Market Trends report for 12 months back in that MLS area, which will provide you with charts and data about how the average price has changed during the last year.
 inancing Trends – Through your conversations with buyers you get the sense that the types of financing they are using today seems to be changing, but you’re looking for some data to back up your hunch. Look no further, because running our Market Stats Comparable Summary report can tell you this information.