![MLS Insight: Statistics Galore on RMLSweb]()
by RMLS Communication Department | Aug 29, 2014
This post is part of MLS Insight, a series about how things work at RMLS™.
In our early years, RMLS™ leadership had the goal of positioning RMLS™ as the primary source for information about the residential real estate market—so statistical information has always been a priority. Then and now, RMLS™ provides compiled data and directs media to working REALTORS® for interpretation and projections.
In other words, our expertise is the WHAT, and we leave the WHY to industry professionals who have access to the buyers and sellers whose activity underpins the data on sales, prices, and listings.
Market Action
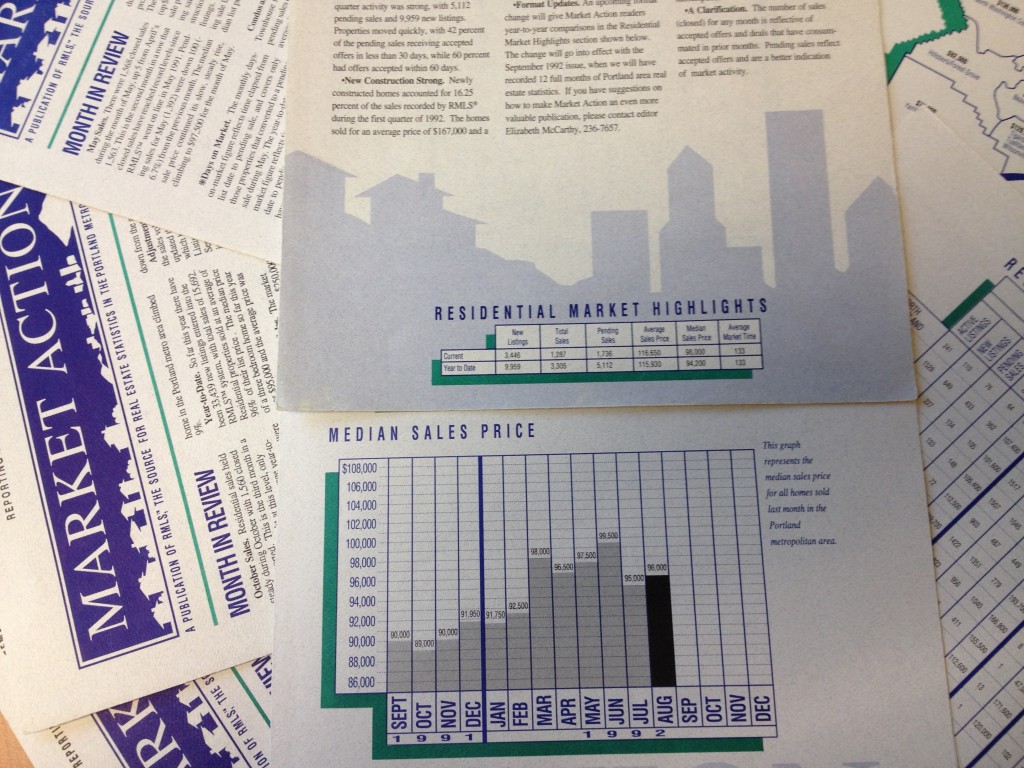
The first issue of our monthly statistical newsletter, Market Action, was published as four printed pages in March 1992. Today Market Action is 69 pages long and covers all the market areas we serve. Next year, we will be expanding coverage to include separate stats for new construction and existing homes. Watch for a survey question in our Annual Subscriber Satisfaction Survey to weigh in on the most important data to include, or leave a comment below.
Market Trends and Market Stats
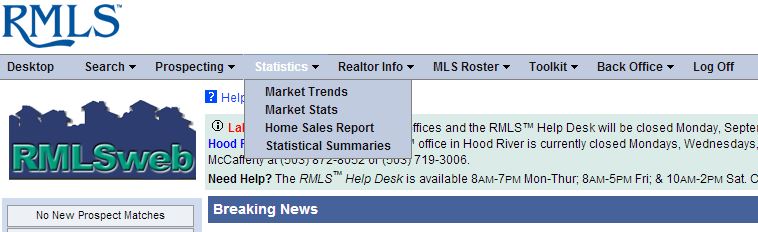
To explore the other statistics reports that RMLS™ has to offer, head to the Statistics tab on the RMLSweb menu bar.
RMLSweb also features video tutorials on how to use both Market Trends and Market Stats. (You can find these and others on RMLSweb by clicking on Training Tutorials under the Toolkit menu.)
Market Trends allows searching by geography (area number, city, ZIP code) and a few other criteria such as bedrooms, year built, lot size, etc. The resulting report produces not only a summary of data by month within the range you select, but also six graphs like the one below that are a click away from copying for your use in your own CMAs or newsletters.
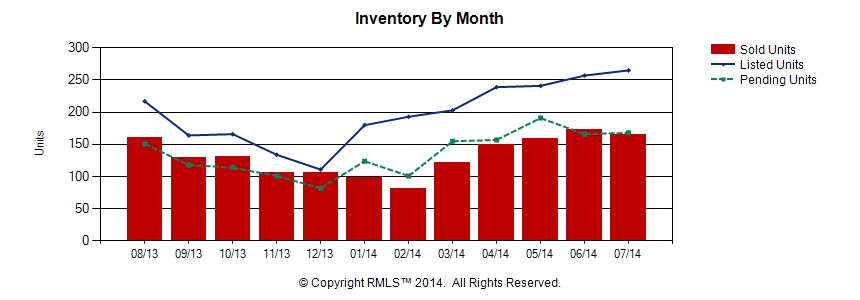
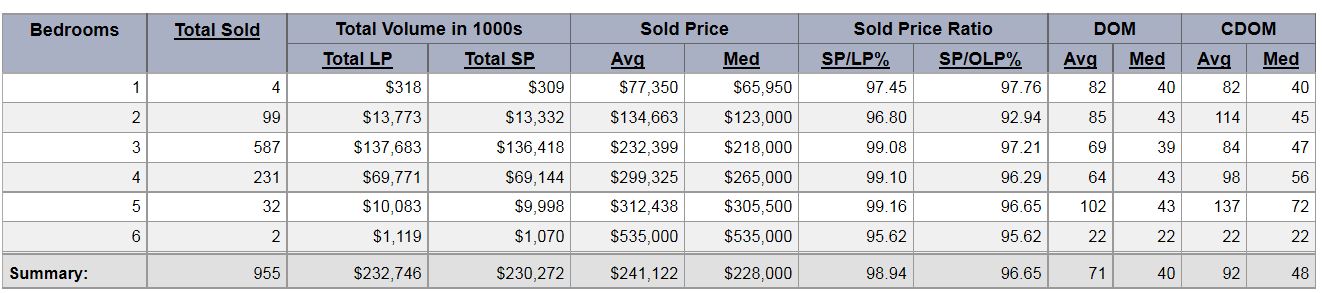
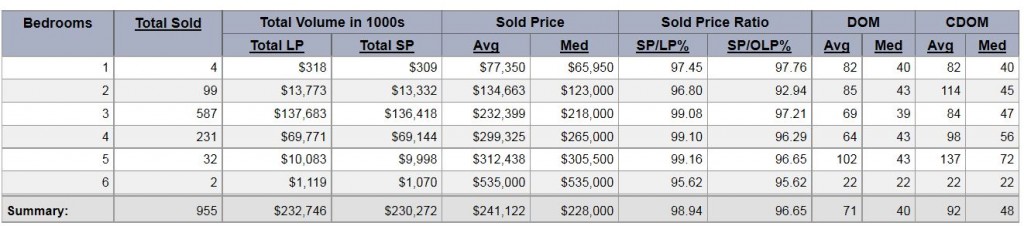
Market Stats provides several reports. The Comparables Report has several additional graphs which depict sales data by sold terms and number of bedrooms. (See below for the type of info available in the Comparables Report.) The Dollar Value by Area and Inventory Reports are strictly data reports that give a very streamlined overview of market areas.
Home Sales Report
In addition to these dynamic reports which pull data according to criteria you select, RMLS™ also provides static reports under the Statistics menu. The Home Sales Report has information as early as 2001. Since July 2011, these reports have presented information for new construction—both separate from existing and combined.
Statistical Summaries
Finally, the Statistical Summaries compile years worth of Market Action historical data into a few pages and provide up to nine annual snapshots of various aspects of the residential real estate market in all our market areas. Access them under the Statistics menu on RMLSweb.
As you can see, RMLS™ takes stats seriously! If you would like to learn more about how to use stats in your business, call RMLS™ Training at (503) 236-7657 to get more information.
Thanks for taking this brief tour highlighting some of the statistical information available from RMLS™. Next month we will talk about envisioning an MLS without area numbers. If you have any questions you would like to have answered about how things work at RMLS™, I encourage you to post a comment to this blog.
![MLS Insight: Statistics Galore on RMLSweb]()
by RMLS Communication Department | Mar 21, 2013
The archive of RMLS™ Market Action statistical summaries on RMLSweb has a fresh new look, thanks to RMLS™ Business Analyst/Policy Manager Christina Smestad.

If you have never seen them, statistical summaries compile many years of data from our Market Action newsletter for most areas in the RMLS™ region so readers can compare long-term market movements in key areas.
In order to improve the statistical summaries we standardized the data, added a few numbers not previously compiled, and reworked the layout to be more readable and printer-friendly. Our revised versions combine average and median sales price into one report and add inventory counts to the summary report. We think you’ll like what you see!
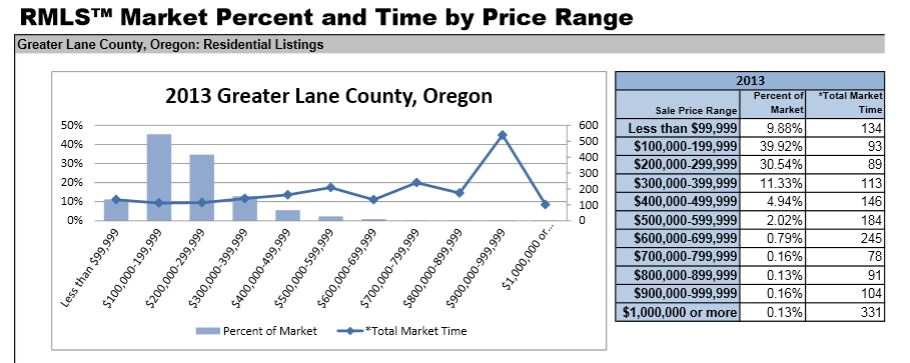
Available reports include average sales price, average and median sales price by area, closed sales, market percent and time by price, median sales price, new listings, pending listings, and a summary report. Affordability summaries are available for the Portland metro area, Clark County, and Lane County. Statistical summaries are currently available for those areas as well as Baker County, Columbia Basin, Coos County, Curry County, Douglas County, Mid-Columbia, Union County, and Wallowa County.
 The treasury of statistical summaries may be accessed online two ways. Currently, subscribers logged in to RMLSweb may navigate to Toolkit->All Documents, then expand the folder titled “Market Action Statistical Summaries” on the left sidebar to find subgroups of specific geographic regions (see image at left).
As of March 28, a shortcut will be available allowing users to access quick links to statistical summaries directly from the RMLSweb menu. Subscribers logged in to RMLSweb may navigate to Statistics->Statistical Summaries for a more navigable list of geographic areas.
Moving forward, RMLS™ will update the statistical summaries more frequently than the annual updates of the past. We’re also working to expand the reports into other areas: Polk and Marion Counties, Grant County, North Coastal Communities, and Cowlitz County are planned additions for the future!
by RMLS Communication Department | Sep 14, 2012
August was a very good month for the real estate market in many of the areas served by RMLS™. In fact, several areas recorded more closed sales than in any single month since 2007. These Oregon regions include the Portland Metro area, Lane County, Douglas County, Coos County and Curry County. Coos and Curry also had more pending sales than in any single month since 2007. The Mid-Columbia area east of Portland Metro, which includes counties on both sides of the Columbia, joined them in the pending category.
Image by Svilen Milev.

by RMLS Communication Department | Jan 14, 2010
Real estate activity in Oregon and SW Washington up in most RMLS areas
In the December 2009 RMLS™ Market Action report, sales activity was up in most areas that we cover, compared to December 2008. Though this is a positive sign, it should be taken with a grain of salt, because last December brought record lows for pending and closed sales in many areas.
Portland saw a 52.6% increase in closed sales this month and a 40.9% increase in pending listings, while Clark County closed sales were up 48.1%, and pending sales rose 33.8%. Baker County, Coos County, Curry County, Lane County, the Mid-Columbia region and Union County also saw both closed and pending sales increase over last December.
Sales volume down for the year in most areas

Given lower sales totals and lower prices, this should come as no surprise, but total sales volume for the year fell in most areas in 2009. Portland dropped from $6.3 billion in 2008 to $5.5 billion this year. Lane County was down from $740 million in 2008 to $669 million in 2009.
Notable, however, is an increase in sales volume in Curry County – up to $66 million this year from $59 million in 2008. And Clark County matched its total sales volume of $1.2 billion in 2008.
Year-end stats, Clark County shines
Clark County seems to be ahead of the pack when it comes to sales activity. For the year, pending sales were up 19.5% and closed sales up 13.8% compared to 2008. That’s far ahead of most areas; for example, in Portland, pending sales were up 4%, and closed sales were down 0.9%. Only Curry County outpaced Clark County in percentage of sales increase for 2009, with pending sales up 31.3% and closed sales up 23.7%.
However, the increase in sales has come at a price – Clark County saw the largest decrease (-12.6%) in median sale price for the 11 areas we cover.
by RMLS Communication Department | Dec 15, 2009
Sales up, but in comparison to a dismal month last November
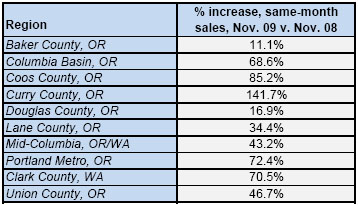
The big highlight this month for many areas is a large jump in closed sales compared to last November. Curry County posted a 141.7% increase and Portland and Clark County set records for percentage increases in same-month sales at 72.4% and 70.5%, respectively.

While these stats are obviously a good sign for market activity, continue to keep in mind that last year we were at the height of the economic crisis and we hit some of the lowest points in sales totals in recent years. So, yes, sales are way up compared to last year, but remember that we’re comparing it to unusually low sales totals.
Has the winter slowdown arrived?
Closed sales had been on the rise in many key areas month-to-month through October, but it appears that the winter slowdown has arrived. Compared to this October, pending and closed sales were down in most areas, including Columbia Basin, Douglas County, Lane County, the Mid-Columbia region, Portland and Clark County.
Inventory up
Inventory ticked up in every area except Curry County and Union County, however, most areas are well below last year’s inventory levels thanks to fewer listings entering the market and higher sales totals. For example, Portland’s inventory stands at 7.1 months – 53% less than last November’s 15 months of inventory.
by RMLS Communication Department | Nov 13, 2009
Same-month sales up nearly across the board in Oregon & Southern Washington
Sales activity continued to outpace levels from the same month last year in the latest RMLS™ Market Action report. Inventory was also down in several areas, including Lane County, Portland and Clark County.
Sales Activity:
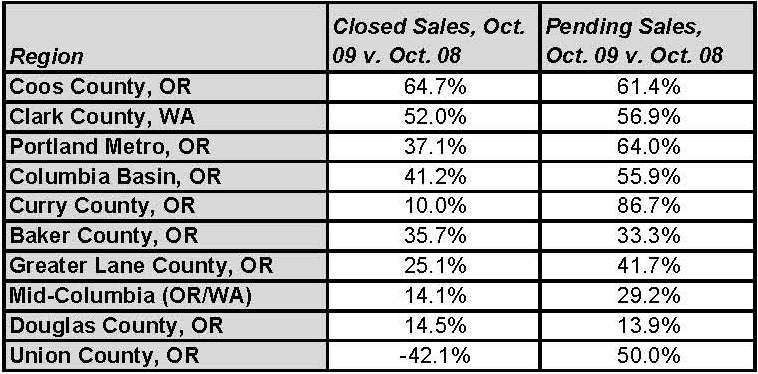
Both pending and closed sales increased in 9 out of 10 of the regions that we cover when compared to the same month in 2008. The Portland metro area saw its largest increase in closed sales since January 2005 , which was also the highest total of closed sales since August 2007. Clark County set a record for pending sales, with an increase of 56.9% compared to last October. Here’s a recap of each region’s same-month sales activity:

It will be interesting to see if this trend of increased sales activity will continue this fall and winter season. The percentage increases were not surprising this month, given the recent strength in sales and considering that last year we saw sales begin to drop in October, kicking off a stretch of slow sales activity that would extend into the first quarter of 2009.
Inventory:
Housing inventory levels dropped in several key areas, including Lane County (6.2 months), Portland (6.5 months, lowest since August 2007) and Clark County (6.4 months, lowest since September 2006). This is somewhat counterintuitive, as inventory levels have often increased as we head into the slower fall and winter seasons. But, considering the following factors, it’s no surprise:
- Low interest rates
- New listings continue to drop in most areas, reducing the supply of homes available
- The perceived tax credit deadline (which has since been extended)
- Lower home prices
What do you think?
Realtors – what do you think? Where do you see the market heading? Have you heard increased interest from buyers and sellers since the tax credit extension/expansion? Comment below!