
by RMLS Communication Department | Jan 14, 2010
Real estate activity in Oregon and SW Washington up in most RMLS areas
In the December 2009 RMLS™ Market Action report, sales activity was up in most areas that we cover, compared to December 2008. Though this is a positive sign, it should be taken with a grain of salt, because last December brought record lows for pending and closed sales in many areas.
Portland saw a 52.6% increase in closed sales this month and a 40.9% increase in pending listings, while Clark County closed sales were up 48.1%, and pending sales rose 33.8%. Baker County, Coos County, Curry County, Lane County, the Mid-Columbia region and Union County also saw both closed and pending sales increase over last December.
Sales volume down for the year in most areas

Given lower sales totals and lower prices, this should come as no surprise, but total sales volume for the year fell in most areas in 2009. Portland dropped from $6.3 billion in 2008 to $5.5 billion this year. Lane County was down from $740 million in 2008 to $669 million in 2009.
Notable, however, is an increase in sales volume in Curry County – up to $66 million this year from $59 million in 2008. And Clark County matched its total sales volume of $1.2 billion in 2008.
Year-end stats, Clark County shines
Clark County seems to be ahead of the pack when it comes to sales activity. For the year, pending sales were up 19.5% and closed sales up 13.8% compared to 2008. That’s far ahead of most areas; for example, in Portland, pending sales were up 4%, and closed sales were down 0.9%. Only Curry County outpaced Clark County in percentage of sales increase for 2009, with pending sales up 31.3% and closed sales up 23.7%.
However, the increase in sales has come at a price – Clark County saw the largest decrease (-12.6%) in median sale price for the 11 areas we cover.
by RMLS Communication Department | Dec 10, 2009
Will new restrictions slow the increase in FHA popularity?
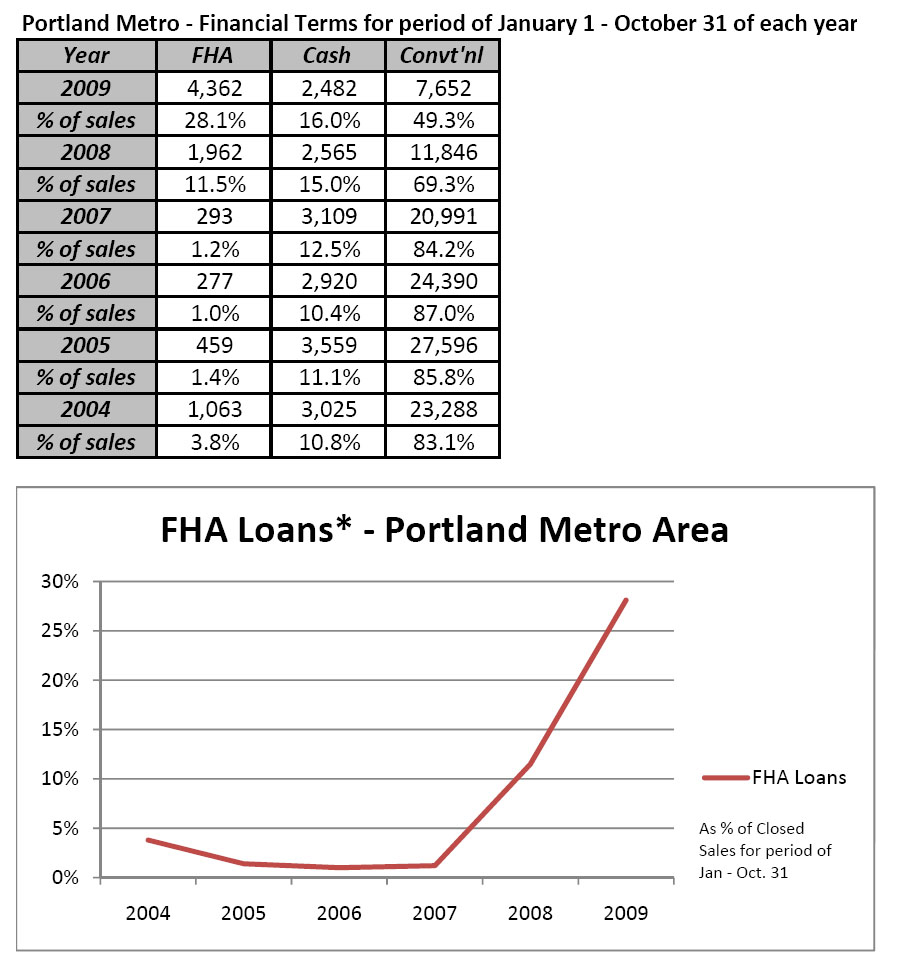
We all know that FHA Loans have increased in the past few years with the changing market, but how much? I recently ran some numbers on financial terms, a required field in RMLSweb, that may shed some light. These numbers are for the Portland metro area (Clackamas, Columbia, Multnomah, Washington and Yamhill counties).

As you can see, sold listings with the financial terms “FHA” have increased in the RMLS Portland market area from just 1.2% in 2007 to 28.1% of sales through October 2009. These numbers are closely in line with national levels; a recent report stated that FHA loans are up to 30% this year from 3% in 2006.
Do you think we’ll continue to see FHA loans grow in popularity, or will it change if plans to make some FHA loans require a down payment higher than 3.5% go through? Realtors, let us know what you’re seeing out in the field – leave a comment below.
by RMLS Communication Department | Nov 20, 2009
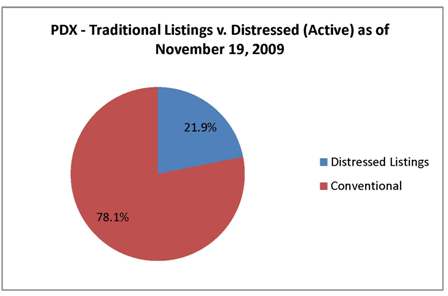
21.9% of listings distressed in PDX, 31.7% in Clark County
The latest report from the Mortgage Bankers Association indicated that the rate of foreclosure for people with fixed rate loans and good credit is on the rise.
The AP reports that homeowners’ inability to keep up with payments is now more due to unemployment, rather than the subprime loans that contributed to the initial increase in foreclosures.
A quick search on RMLSweb reveals that in the Portland Metro area, distressed properties currently make up 21.9% of active residential listings (this number takes into account listings that require third-party approval, as this typically indicates a short sale and those that are marked as bank-owned).

In Clark County, 31.7% of residential listings are distressed.

by RMLS Communication Department | Oct 22, 2009
Top 5 Areas with the Lowest Housing Inventory in September, Portland & Clark County
Below are the five MLS areas with the lowest supply of housing inventory for September 2009 for the Clark County and Portland metro areas. Inventory measures how long, in theory, it would take to exhaust the current supply of housing. We arrive at this number by dividing the number active listings by the number of sales for the month.
Clark County
| Area |
Area # |
Actives |
Sales |
Inventory |
| Lincoln/Hazel Dell |
14 |
34 |
10 |
3.4 |
| Five Corners |
25 |
89 |
18 |
4.9 |
| East Orchards |
26 |
90 |
18 |
5.0 |
| Cascade Park |
24 |
105 |
20 |
5.3 |
| Evergreen |
22 |
276 |
51 |
5.4 |
Portland Metro
| Area |
Area # |
Actives |
Sales |
Inventory |
| Beaverton/Aloha |
150 |
1,007 |
204 |
4.9 |
| NE Portland |
142 |
1,016 |
185 |
5.5 |
| North Portland |
141 |
455 |
75 |
6.1 |
| Southeast Portland |
143 |
1,396 |
228 |
6.1 |
| Hillsboro/Forest Grove |
152 |
880 |
142 |
6.2 |
by RMLS Communication Department | Oct 16, 2009
Residential real estate sales tick up in several areas, inventory down
This month’s RMLS™ Market Action report showed a trend of increasing real estate sales & subsequently lower housing inventory in many areas of Oregon & Southwest Washington.
Sales Activity:
Closed sales rose in the following areas this month, compared to the same month in 2008:
| Area |
Closed Sales |
| Curry County, Oregon |
100% |
| Columbia Basin, Oregon |
36.6% |
| Lane County, Oregon |
23.2% |
| Clark County, Washington |
20.2% |
| Portland Metro, Oregon |
9.8% |
Third Quarter Sales Up:
September marked the end of the third quarter and compared to Q3 in 2008, Coos County, Curry County, Douglas County, Lane County, Portland and Clark County all saw sales outpace Q3 in 2008. Clark County led the pack at a clip of 18.7%.
Inventory:
Ten of eleven areas that we cover in the Market Action report saw housing inventory drop from August. This can be attributed to rising sales in several areas and as we head into the slower fall & winter seasons, fewer homes are being listed as well.
Both the Portland and Clark County areas saw inventory drop to 7.6 months. Lane County has the lowest inventory of the areas we cover at 6.8 months.