RMLS™ has been working with Earth Advantage® to facilitate populating this important information to listings on RMLSweb. On December 6th, RMLS™ will release a “Load from Green Building Registry” button in the Green/Energy Supplement on RMLSweb. All homes with a listing address in the City of Portland will have this supplement automatically included in Listing Load. While we are introducing the ability to populate this information in a listing, the fields will remain unrequired.
When this button is selected, the listing address will be sent to the Green Building Registry database. If an address match occurs and the address has a home energy report on file, the score and report URL will autopopulate into the Green/Energy Supplement form. In addition, the home energy report and report URL will be added to the end of the Public Remarks field in data feeds, including IDX sites that get listing information from RMLS™.
RMLS™ is aware that some properties may have Portland addresses that do not fall within the jurisdiction of the City of Portland. The Administrative Rules of the Residential Energy Performance Rating and Disclosures, Part 3.3.1, provide guidelines to determine if a property must have a Home Energy Score. If a property has received a Home Energy Score but the “Load from Green Building Registry” button did not find a match, contact RMLS™ so we can make improvements to this process. This situation could occur if the address entered in Listing Load does not match the address recorded in the Green Building Registry. REALTORS® are encouraged to use PortlandMaps as a reference to find the correct listing address.
The Home Energy Score button is now live on RMLSweb. Earth Advantage has produced a short demonstration of how the feature works, below. RMLS™ will produce a similar tutorial in the coming weeks.
The archive of RMLS™ Market Action statistical summaries on RMLSweb has a fresh new look, thanks to RMLS™ Business Analyst/Policy Manager Christina Smestad.
If you have never seen them, statistical summaries compile many years of data from our Market Action newsletter for most areas in the RMLS™ region so readers can compare long-term market movements in key areas.
In order to improve the statistical summaries we standardized the data, added a few numbers not previously compiled, and reworked the layout to be more readable and printer-friendly. Our revised versions combine average and median sales price into one report and add inventory counts to the summary report. We think you’ll like what you see!
Available reports include average sales price, average and median sales price by area, closed sales, market percent and time by price, median sales price, new listings, pending listings, and a summary report. Affordability summaries are available for the Portland metro area, Clark County, and Lane County. Statistical summaries are currently available for those areas as well as Baker County, Columbia Basin, Coos County, Curry County, Douglas County, Mid-Columbia, Union County, and Wallowa County.
The treasury of statistical summaries may be accessed online two ways. Currently, subscribers logged in to RMLSweb may navigate to Toolkit->All Documents, then expand the folder titled “Market Action Statistical Summaries” on the left sidebar to find subgroups of specific geographic regions (see image at left).
As of March 28, a shortcut will be available allowing users to access quick links to statistical summaries directly from the RMLSweb menu. Subscribers logged in to RMLSweb may navigate to Statistics->Statistical Summaries for a more navigable list of geographic areas.
Moving forward, RMLS™ will update the statistical summaries more frequently than the annual updates of the past. We’re also working to expand the reports into other areas: Polk and Marion Counties, Grant County, North Coastal Communities, and Cowlitz County are planned additions for the future!
The Pacific Northwest gets a lot of rain, and stormwater runoff can be challenging to manage. Many cities in the region are starting to build green street facilities in residential areas to reduce the risk of flooding and provide other benefits.
The City of Portland recently released a guide for REALTORS® and homeowners called “Buying or Selling a House with a Green Street Facility.” The guide outlines basic information about these facilities, including how to report a need for maintenance.
Additionally, the caretakers of these facilities remind REALTORS® and homeowners of the following:
• Place “for sale” signs in yards rather than green street facilties or between curbs and sidewalks.
• Inform clients that green streets are publicly owned stormwater management facilities.
• If a green street facility near a property on the market needs maintenance, contact the City of Portland.
Facilities like these exist outside of Portland as well—REALTORS® in other areas may equally benefit from reviewing these materials.
Real estate activity in Oregon and SW Washington up in most RMLS areas
In the December 2009 RMLS™ Market Action report, sales activity was up in most areas that we cover, compared to December 2008. Though this is a positive sign, it should be taken with a grain of salt, because last December brought record lows for pending and closed sales in many areas.
Portland saw a 52.6% increase in closed sales this month and a 40.9% increase in pending listings, while Clark County closed sales were up 48.1%, and pending sales rose 33.8%. Baker County, Coos County, Curry County, Lane County, the Mid-Columbia region and Union County also saw both closed and pending sales increase over last December.
Sales volume down for the year in most areas
Given lower sales totals and lower prices, this should come as no surprise, but total sales volume for the year fell in most areas in 2009. Portland dropped from $6.3 billion in 2008 to $5.5 billion this year. Lane County was down from $740 million in 2008 to $669 million in 2009.
Notable, however, is an increase in sales volume in Curry County – up to $66 million this year from $59 million in 2008. And Clark County matched its total sales volume of $1.2 billion in 2008.
Year-end stats, Clark County shines
Clark County seems to be ahead of the pack when it comes to sales activity. For the year, pending sales were up 19.5% and closed sales up 13.8% compared to 2008. That’s far ahead of most areas; for example, in Portland, pending sales were up 4%, and closed sales were down 0.9%. Only Curry County outpaced Clark County in percentage of sales increase for 2009, with pending sales up 31.3% and closed sales up 23.7%.
However, the increase in sales has come at a price – Clark County saw the largest decrease (-12.6%) in median sale price for the 11 areas we cover.
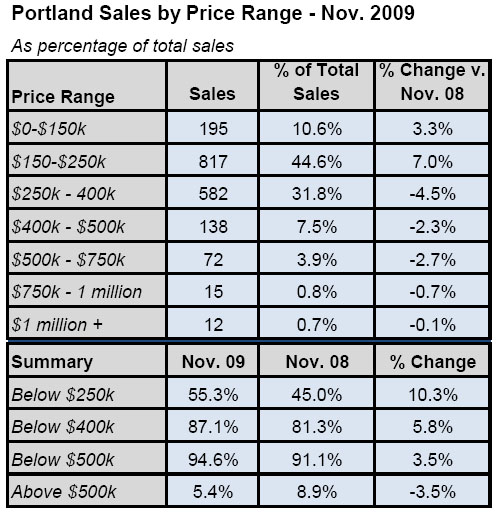
RMLS Portland home sales by price range, November 2009
The original deadline for the homebuyer tax credit was November 30 and it appears that this may have had an effect on home sales in November. Homes that sold for $250,000 or below (likely the price range for many first-time buyers) made up 55.3% of all sales in Portland this November, which is up 10.3% compared to November 2008.
Sales up, but in comparison to a dismal month last November
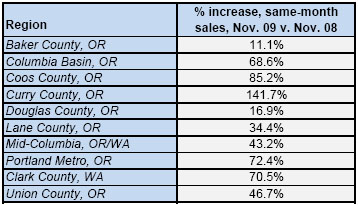
The big highlight this month for many areas is a large jump in closed sales compared to last November. Curry County posted a 141.7% increase and Portland and Clark County set records for percentage increases in same-month sales at 72.4% and 70.5%, respectively.
While these stats are obviously a good sign for market activity, continue to keep in mind that last year we were at the height of the economic crisis and we hit some of the lowest points in sales totals in recent years. So, yes, sales are way up compared to last year, but remember that we’re comparing it to unusually low sales totals.
Has the winter slowdown arrived?
Closed sales had been on the rise in many key areas month-to-month through October, but it appears that the winter slowdown has arrived. Compared to this October, pending and closed sales were down in most areas, including Columbia Basin, Douglas County, Lane County, the Mid-Columbia region, Portland and Clark County.
Inventory up Inventory ticked up in every area except Curry County and Union County, however, most areas are well below last year’s inventory levels thanks to fewer listings entering the market and higher sales totals. For example, Portland’s inventory stands at 7.1 months – 53% less than last November’s 15 months of inventory.