by Grant | Feb 10, 2023
Your Market Action report has a brand-new look starting with the January 2023 edition. We’re excited to present you with a fully refreshed design, along with new content and resources.
We prioritized creating a clean design that is easy to navigate, orderly, and delivers an improved reading experience.
Additionally, we added more statistical value by adding five new data charts, explanations for key definitions and formulas, and convenient links to other statistical content that RMLS provides.
Here’s a breakdown of what’s new for each area:
- NEW DATA CHARTS
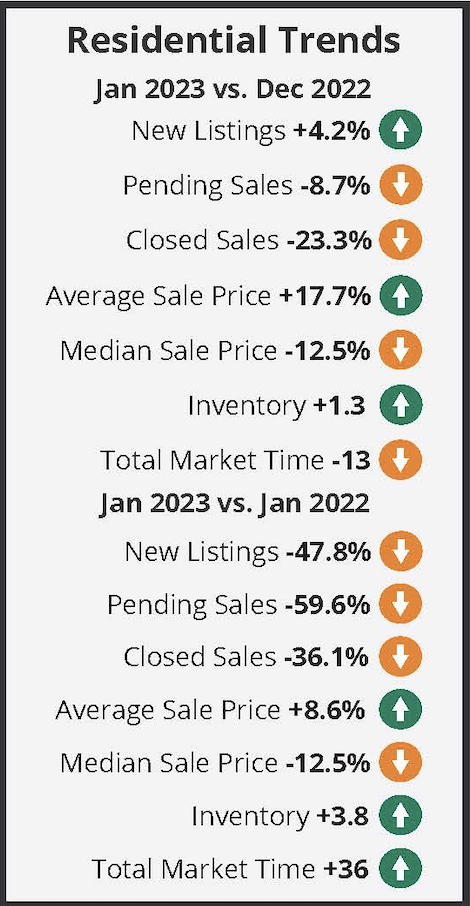
- Residential Trends: This chart will show the percentage change between the current month / year vs the corresponding month of the previous year.
- Residential Sales by Price Range: This ‘heat map’ chart shows the number of sold residences broken down by $100K sale price tiers.
- Average Sold Price Change: The percentage change for the average sold price by month is displayed.
- Average Square Footage: The average square footage total for sold properties is given.
- Average Price Per Square Footage: This chart shows a monthly comparison of average price per square foot for sold properties.
- ADDITIONAL RESOURCES
- Definitions and Formulas: This page explains some of the key terminology and formulas in use for the Market Action.
- Resource Links: RMLS subscribers will have the benefit of linking directly to other statistical content that we offer, including our monthly state and regional infographics folders, the Real Talk with RMLS podcast, statistical reports, statistical summaries, and market trends.
If you’re using the All Areas report, which includes all of the regions that RMLS covers, you can now navigate from area to area more easily with a linked Table of Contents.
In the coming months, we’re planning to release additional infographics and content to support your use of the Market Action data. We hope you enjoy the new look and benefit from the new market data we’ve put together for you.
If you have questions or feedback, please contact communications@rmls.com. We look forward to hearing from you!
![Residential Distressed Properties for Fourth Quarter (October-December) 2016]()
by RMLS Communication Department | Feb 2, 2017

This chart shows the number of bank owned/REO properties and short sales in all areas of the RMLS™ system during the fourth quarter of 2016.
Below are links to additional charts for some of our larger areas.
• Portland Metro Area Distressed Properties (4th Quarter 2016)
• Clark County, WA Distressed Properties (4th Quarter 2016)
• Lane County, OR Distressed Properties (4th Quarter 2016)
• Douglas County, OR Distressed Properties (4th Quarter 2016)
• Coos County, OR Distressed Properties (4th Quarter 2016)
Here are some additional facts about distressed residential properties in the fourth quarter of 2016:
All areas when comparing percentage share of the market, fourth quarter to third quarter 2016:
• When comparing fourth quarter to third quarter 2016, distressed sales as a percentage of new listings increased by 2.0% (5.9 v. 3.9%).
• In a comparison of fourth quarter to third quarter 2016, distressed sales as a percentage of closed sales decreased by 0.4% (4.7 v. 5.1%).
• Short sales comprised 1.0% of new listings and 0.8% of sales in the fourth quarter, up 0.3% and down 0.2% from the third quarter of 2016, respectively.
• Bank owned/REO properties comprised 4.9% of new listings and 3.9% of sales in the fourth quarter, up 1.7% and down 0.2% from the third quarter of 2016, respectively.
Portland metro when comparing percentage share of the market, fourth quarter to third quarter 2016:
• When comparing fourth quarter to third quarter 2016, distressed sales as a percentage of new listings increased by 1.3% (4.2 v. 2.9%).
• In a comparison of fourth quarter to third quarter 2016, distressed sales as a percentage of closed sales decreased by 2.6% (3.8 v. 6.4%).
• Short sales comprised 1.0% of new listings and 0.9% of sales in the fourth quarter, up 0.4% and down 0.8% from the third quarter of 2016, respectively.
• Bank owned/REO properties comprised 3.2% of new listings and 2.9% of sales in the fourth quarter, up 0.9% and down 1.8% from the third quarter of 2016, respectively.
Clark County when comparing percentage share of the market, fourth quarter to third quarter 2016:
• When comparing fourth quarter to third quarter 2016, distressed sales as a percentage of new listings increased by 0.8% (3.6 v. 2.8%).
• In a comparison of fourth quarter to third quarter 2016, distressed sales as a percentage of closed sales decreased by 0.8% (2.7 v. 3.5%).
• Short sales comprised 0.9% of new listings and 1.0% of sales in the fourth quarter, down 0.4% and unchanged for sales when compared to the third quarter of 2016.
• Bank owned/REO properties comprised 2.7% of new listings and 1.7% of sales in the fourth quarter, up 1.2% and down 0.8% from the third quarter of 2016, respectively.
RMLS™ is pausing its quarterly publication of distressed properties information with the closing of 2016. If distressed properties become a larger portion of residential home sales in the future, distribution of this data may begin again.
If you’d like more information or percentages of distressed residential sales in other areas not represented by our charts, please contact us at communications@rmls.com.
![Residential Distressed Properties for Fourth Quarter (October-December) 2016]()
by RMLS Communication Department | Oct 27, 2016

This chart shows the number of bank owned/REO properties and short sales in all areas of the RMLS™ system during the third quarter of 2016.
Below are links to additional charts for some of our larger areas.
• Portland Metro Area Distressed Properties (3rd Quarter 2016)
• Clark County, WA Distressed Properties (3rd Quarter 2016)
• Lane County, OR Distressed Properties (3rd Quarter 2016)
• Douglas County, OR Distressed Properties (3rd Quarter 2016)
• Coos County, OR Distressed Properties (3rd Quarter 2016)
Here are some additional facts about distressed residential properties in the third quarter of 2016:
All areas when comparing percentage share of the market, third quarter to second quarter 2016:
• When comparing third quarter to second quarter 2016, distressed sales as a percentage of new listings decreased by 0.2% (3.9 v. 4.1%).
• In a comparison of third quarter to second quarter 2016, distressed sales as a percentage of closed sales decreased by 1.7% (5.1 v. 6.8%).
• Short sales comprised 0.7% of new listings and 1.0% of sales in the third quarter, down 0.1% and 0.3% from the second quarter of 2016, respectively.
• Bank owned/REO properties comprised 3.2% of new listings and 4.1% of sales in the third quarter, down 0.1% and 1.4% from the second quarter of 2016, respectively.
Portland metro when comparing percentage share of the market, third quarter to second quarter 2016:
• When comparing third quarter to second quarter 2016, distressed sales as a percentage of new listings decreased by 0.4% (2.9 v. 3.3%).
• In a comparison of third quarter to second quarter 2016, distressed sales as a percentage of closed sales increased by 0.9% (6.4 v. 5.5%).
• Short sales comprised 0.6% of new listings and 1.7% of sales in the third quarter, down 0.1% and up 0.5% from the second quarter of 2016, respectively.
• Bank owned/REO properties comprised 2.3% of new listings and 4.7% of sales in the third quarter, down 0.3% and up 0.4% from the second quarter of 2016, respectively.
Clark County when comparing percentage share of the market, third quarter to second quarter 2016:
• When comparing third quarter to second quarter 2016, distressed sales as a percentage of new listings decreased by 0.4% (2.8 v. 3.2%).
• In a comparison of third quarter to second quarter 2016, distressed sales as a percentage of closed sales decreased by 1.7% (3.5 v. 5.2%).
• Short sales comprised 1.3% of new listings and 1.0% of sales in the third quarter, unchanged for new listings and down 1.5% when compared to the second quarter of 2016, respectively.
• Bank owned/REO properties comprised 1.5% of new listings and 2.5% of sales in the third quarter, down 0.4% and 0.2% from the second quarter of 2016, respectively.
If you’d like more information or percentages of distressed residential sales in other areas not represented by our charts, please contact us at communications@rmls.com.
![Residential Distressed Properties for Fourth Quarter (October-December) 2016]()
by RMLS Communication Department | Jul 22, 2016

This chart shows the number of bank owned/REO properties and short sales in all areas of the RMLS™ system during the second quarter of 2016.
Below are links to additional charts for some of our larger areas.
• Portland Metro Area Distressed Properties (2nd Quarter 2016)
• Clark County, WA Distressed Properties (2nd Quarter 2016)
• Lane County, OR Distressed Properties (2nd Quarter 2016)
• Douglas County, OR Distressed Properties (2nd Quarter 2016)
• Coos County, OR Distressed Properties (2nd Quarter 2016)
Here are some additional facts about distressed residential properties in the second quarter of 2016:
All areas when comparing percentage share of the market, second quarter to first quarter 2016:
• When comparing second quarter to first quarter 2016, distressed sales as a percentage of new listings decreased by 3.0% (4.1 v. 7.1%).
• In a comparison of second quarter to first quarter 2016, distressed sales as a percentage of closed sales decreased by 3.8% (6.8 v. 10.6%).
• Short sales comprised 0.8% of new listings and 1.3% of sales in the second quarter, down 0.7% and 0.6% from the first quarter of 2016, respectively.
• Bank owned/REO properties comprised 3.3% of new listings and 5.5% of sales in the second quarter, down 2.3% and 3.2% from the first quarter of 2016, respectively.
Portland metro when comparing percentage share of the market, second quarter to first quarter 2016:
• When comparing second quarter to first quarter 2016, distressed sales as a percentage of new listings decreased by 2.7% (3.3 v. 6.0%).
• In a comparison of second quarter to first quarter 2016, distressed sales as a percentage of closed sales decreased by 4.1% (5.5 v. 9.6%).
• Short sales comprised 0.7% of new listings and 1.2% of sales in the second quarter, down 0.7% and 1.0% from the first quarter of 2016, respectively.
• Bank owned/REO properties comprised 2.6% of new listings and 4.3% of sales in the second quarter, down 2.0% and 3.1% from the first quarter of 2016, respectively.
Clark County when comparing percentage share of the market, second quarter to first quarter 2016:
• When comparing second quarter to first quarter 2016, distressed sales as a percentage of new listings decreased by 2.6% (3.2 v. 5.8%).
• In a comparison of second quarter to first quarter 2016, distressed sales as a percentage of closed sales decreased by 0.8% (5.2 v. 6.0%).
• Short sales comprised 1.3% of new listings and 2.5% of sales in the second quarter, down 1.2% for new listings and up 0.6% when compared to the first quarter of 2016, respectively.
• Bank owned/REO properties comprised 1.9% of new listings and 2.7% of sales in the second quarter, down 1.4% and 1.4% from the first quarter of 2016, respectively.
If you’d like more information or percentages of distressed residential sales in other areas not represented by our charts, please contact us at communications@rmls.com.
![Residential Distressed Properties for Fourth Quarter (October-December) 2016]()
by RMLS Communication Department | Apr 20, 2016

This chart shows the number of bank owned/REO properties and short sales in all areas of the RMLS™ system during the first quarter of 2016.
Below are links to additional charts for some of our larger areas.
• Portland Metro Area Distressed Properties (1st Quarter 2016)
• Clark County, WA Distressed Properties (1st Quarter 2016)
• Lane County, OR Distressed Properties (1st Quarter 2016)
• Douglas County, OR Distressed Properties (1st Quarter 2016)
• Coos County, OR Distressed Properties (1st Quarter 2016)
Here are some additional facts about distressed residential properties in the first quarter of 2016:
All areas when comparing percentage share of the market, first quarter 2016 to fourth quarter 2015:
• When comparing first quarter 2016 to fourth quarter 2015, distressed sales as a percentage of new listings decreased by 3.0% (7.1 v. 10.1%).
• In a comparison of first quarter 2016 to fourth quarter 2015, distressed sales as a percentage of closed sales decreased by 2.1% (10.6 v. 8.5%).
• Short sales comprised 1.5% of new listings and 1.9% of sales in the first quarter of 2016, down 0.7% and up 0.2% from the fourth quarter of 2015, respectively.
• Bank owned/REO properties comprised 5.6% of new listings and 8.7% of sales in the first quarter of 2016, down 2.3% and up 1.9% from the fourth quarter of 2015, respectively.
Portland metro when comparing percentage share of the market, first quarter 2016 to fourth quarter 2015:
• When comparing first quarter 2016 to fourth quarter 2015, distressed sales as a percentage of new listings decreased by 3.2% (6.0 v. 9.2%).
• In a comparison of first quarter 2016 to fourth quarter 2015, distressed sales as a percentage of closed sales increased by 1.9% (9.6 v. 7.7%).
• Short sales comprised 1.4% of new listings and 2.2% of sales in the first quarter of 2016, down 0.7% and up 0.4% from the fourth quarter of 2015, respectively.
• Bank owned/REO properties comprised 4.6% of new listings and 7.4% of sales in the first quarter of 2016, down 2.5% and up 1.5% from the fourth quarter of 2015, respectively.
Clark County when comparing percentage share of the market, first quarter 2016 to fourth quarter 2015:
• When comparing first quarter 2016 to fourth quarter 2015, distressed sales as a percentage of new listings decreased by 1.2% (5.8 v. 7.0%).
• In a comparison of first quarter 2016 to fourth quarter 2015, distressed sales as a percentage of closed sales remained unchanged (6.0 v. 6.0%).
• Short sales comprised 2.5% of new listings and 1.9% of sales in the first quarter of 2016, down 0.9% for new listings and exactly matching sales when compared to the fourth quarter of 2015, respectively.
• Bank owned/REO properties comprised 3.3% of new listings and 4.1% of sales in the first quarter of 2016, down 0.3% and exactly matching the fourth quarter of 2015, respectively.
If you’d like more information or percentages of distressed residential sales in other areas not represented by our charts, please contact us at communications@rmls.com.
![Residential Distressed Properties for Fourth Quarter (October-December) 2016]()
by RMLS Communication Department | Jan 26, 2016

This chart shows the number of bank owned/REO properties and short sales in all areas of the RMLS™ system during the fourth quarter of 2015.
Below are links to additional charts for some of our larger areas.
• Portland Metro Area Distressed Properties (4th Quarter 2015)
• Clark County, WA Distressed Properties (4th Quarter 2015)
• Lane County, OR Distressed Properties (4th Quarter 2015)
• Douglas County, OR Distressed Properties (4th Quarter 2015)
• Coos County, OR Distressed Properties (4th Quarter 2015)
Here are some additional facts about distressed residential properties in the fourth quarter of 2015:
All areas when comparing percentage share of the market, fourth quarter to third quarter 2015:
• When comparing fourth quarter to third quarter 2015, distressed sales as a percentage of new listings increased by 3.7% (10.1 v. 6.4%).
• In a comparison of fourth quarter to third quarter 2015, distressed sales as a percentage of closed sales increased by 0.9% (8.5 v. 7.6%).
• Short sales comprised 2.2% of new listings and 1.7% of sales in the fourth quarter, up 0.7% and down 0.2% from the third quarter of 2015, respectively.
• Bank owned/REO properties comprised 7.9% of new listings and 6.8% of sales in the fourth quarter, up 3.0% and 1.1% from the third quarter of 2015, respectively.
Portland metro when comparing percentage share of the market, fourth quarter to third quarter 2015:
• When comparing fourth quarter to third quarter 2015, distressed sales as a percentage of new listings increased by 3.8% (9.2 v. 5.4%).
• In a comparison of fourth quarter to third quarter 2015, distressed sales as a percentage of closed sales increased by 1.3% (7.7 v. 6.4%).
• Short sales comprised 2.1% of new listings and 1.8% of sales in the fourth quarter, up 0.7% and 0.1% from the third quarter of 2015, respectively.
• Bank owned/REO properties comprised 7.1% of new listings and 5.9% of sales in the fourth quarter, up 3.1% and 1.2% from the third quarter of 2015, respectively.
Clark County when comparing percentage share of the market, fourth quarter 2015 to third quarter 2015:
• When comparing fourth quarter to third quarter 2015, distressed sales as a percentage of new listings increased by 2.0% (7.0 v. 5.0%).
• In a comparison of fourth quarter to third quarter 2015, distressed sales as a percentage of closed sales decreased by 0.3% (6.0 v. 6.3%).
• Short sales comprised 3.4% of new listings and 1.9% of sales in the fourth quarter, up 1.5% for new listings and down 0.7% for sales when compared to the third quarter of 2015, respectively.
• Bank owned/REO properties comprised 3.6% of new listings and 4.1% of sales in the fourth quarter, up 0.5% and 0.4% from the third quarter of 2015, respectively.
If you’d like more information or percentages of distressed residential sales in other areas not represented by our charts, please contact us at communications@rmls.com.


