![Updated Home Sales Reports Now On RMLSweb!]()
by RMLS Communication Department | Oct 31, 2011
A new User Interface and updated reports are now available
The previous Home Sales Report feature on RMLSweb was known to be slow and sometimes inefficient. Therefore, in February 2011, the RMLS™ Board of Directors voted to approve a project for 2011 that would involve rewriting the Home Sales Report feature. This rewrite included redesigning the User Interface, as well as the generated reports themselves.
Now, the updated Home Sales Reports, in addition to the new User Interface, are available for subscribers’ use! To access the Home Sales Reports, go to the RMLSweb Desktop page. Next, locate the “Statistics” menu at the top of the screen and select “Home Sales Report” from the menu options. The new Home Sales Report feature utilizes dropdown and multiple-select fields to allow for a quicker and easier user experience. View our new tutorial, Utilizing Home Sales Reports to learn more.
Here is an example of the new User Interface for the Home Sales Report feature (feel free to click on it for a larger view):

Notice the four new report options under the Generate Report column. Part of our redesign included adding the option of viewing four separate reports for the following:
- New Residential (Year Built Description is New, Proposed or Under Construction)
- Existing Residential (Year Built Description is not New, not Proposed or not Under Construction)
- Total Residential (Total of New and Existing listings)
- Active/Pending Residential (Pending Calculation is New!)
NOTE: For reports prior to July 2011, you will not be able to view the four different report options. All reports through June 2011 will stay in the old one-page format.
The new User Interface allows for a maximum of 35 area reports to be selected. Also, users can select multiple regions or reports by using the Ctrl or Shift keys.
In addition to the new User Interface and additional report options, we also revised the generated reports to more closely resemble data collected by the National Association of Realtors®. For example, we added additional price classes to better portray the market (this change will only affect the newly created reports from July 2011 on). The highest price class that the old reports offered was for listings that were “Over 500,000” (in dollars). With the new report, we have added the following options for Type Price Class:
- $500,000 to 749,999
- $750,000 to 999,999
- $1 million to 1,249,999
- $1.25 million to 1,499,999
- $1.5 million to 1,999,999
- $2 million to 2,999,999
- $3 million and over
View our brand new tutorial, Utilizing Home Sales Reports, to learn more about the new functionality and report options.
Still need help? Feel free to call the RMLS™ Help Desk at 503-872-8002 or toll-free at 877-256-2169.
by RMLS Communication Department | Dec 15, 2009
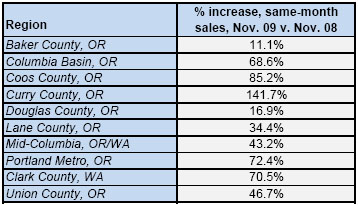
Sales up, but in comparison to a dismal month last November
The big highlight this month for many areas is a large jump in closed sales compared to last November. Curry County posted a 141.7% increase and Portland and Clark County set records for percentage increases in same-month sales at 72.4% and 70.5%, respectively.

While these stats are obviously a good sign for market activity, continue to keep in mind that last year we were at the height of the economic crisis and we hit some of the lowest points in sales totals in recent years. So, yes, sales are way up compared to last year, but remember that we’re comparing it to unusually low sales totals.
Has the winter slowdown arrived?
Closed sales had been on the rise in many key areas month-to-month through October, but it appears that the winter slowdown has arrived. Compared to this October, pending and closed sales were down in most areas, including Columbia Basin, Douglas County, Lane County, the Mid-Columbia region, Portland and Clark County.
Inventory up
Inventory ticked up in every area except Curry County and Union County, however, most areas are well below last year’s inventory levels thanks to fewer listings entering the market and higher sales totals. For example, Portland’s inventory stands at 7.1 months – 53% less than last November’s 15 months of inventory.
by RMLS Communication Department | Nov 9, 2009
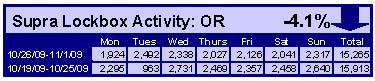
Real estate activity up slightly in Washington, down in Oregon
When comparing the week of October 26 – November 1 with the week prior, the number of times an RMLS™ subscriber opened a Supra lockbox increased 0.3% in Washington and decreased 4.1% in Oregon.


Click the chart for a larger view (Washington, top; Oregon, bottom)
Archive
View an archive of the Supra lockbox statistical reports on Flickr.
by RMLS Communication Department | Oct 22, 2009
Top 5 Areas with the Lowest Housing Inventory in September, Portland & Clark County
Below are the five MLS areas with the lowest supply of housing inventory for September 2009 for the Clark County and Portland metro areas. Inventory measures how long, in theory, it would take to exhaust the current supply of housing. We arrive at this number by dividing the number active listings by the number of sales for the month.
Clark County
| Area |
Area # |
Actives |
Sales |
Inventory |
| Lincoln/Hazel Dell |
14 |
34 |
10 |
3.4 |
| Five Corners |
25 |
89 |
18 |
4.9 |
| East Orchards |
26 |
90 |
18 |
5.0 |
| Cascade Park |
24 |
105 |
20 |
5.3 |
| Evergreen |
22 |
276 |
51 |
5.4 |
Portland Metro
| Area |
Area # |
Actives |
Sales |
Inventory |
| Beaverton/Aloha |
150 |
1,007 |
204 |
4.9 |
| NE Portland |
142 |
1,016 |
185 |
5.5 |
| North Portland |
141 |
455 |
75 |
6.1 |
| Southeast Portland |
143 |
1,396 |
228 |
6.1 |
| Hillsboro/Forest Grove |
152 |
880 |
142 |
6.2 |
by RMLS Communication Department | Oct 19, 2009
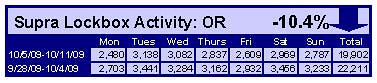
Activity Slides in Oregon & Washington
When comparing the week of October 5 – 11 with the week prior, the number of times an RMLS™ subscriber opened a Supra lockbox decreased 7.7% in Washington and 10.4% in Oregon.
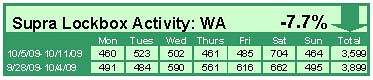

Click the chart for a larger view (Washington, top; Oregon, bottom)
Archive
View an archive of the Supra lockbox statistical reports on Flickr.