by RMLS Communication Department | Feb 1, 2016
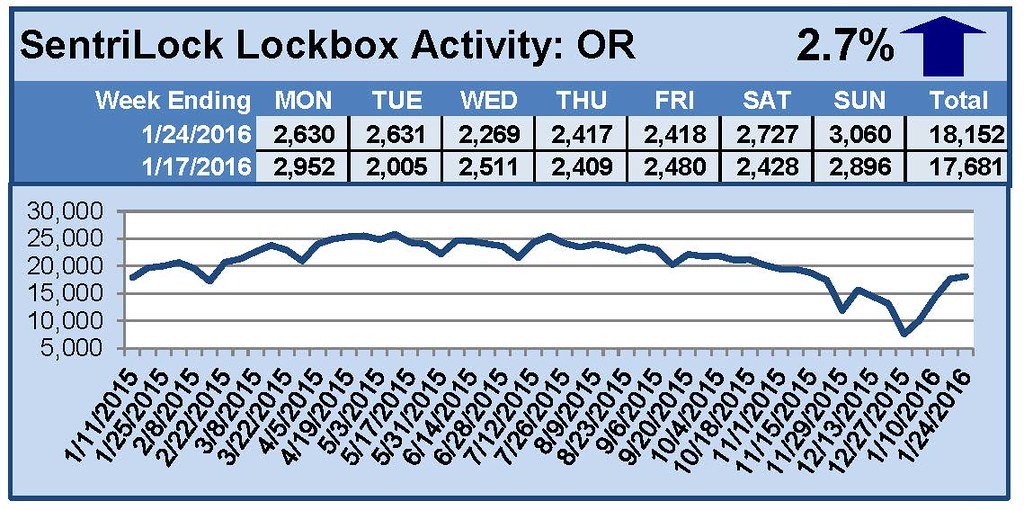
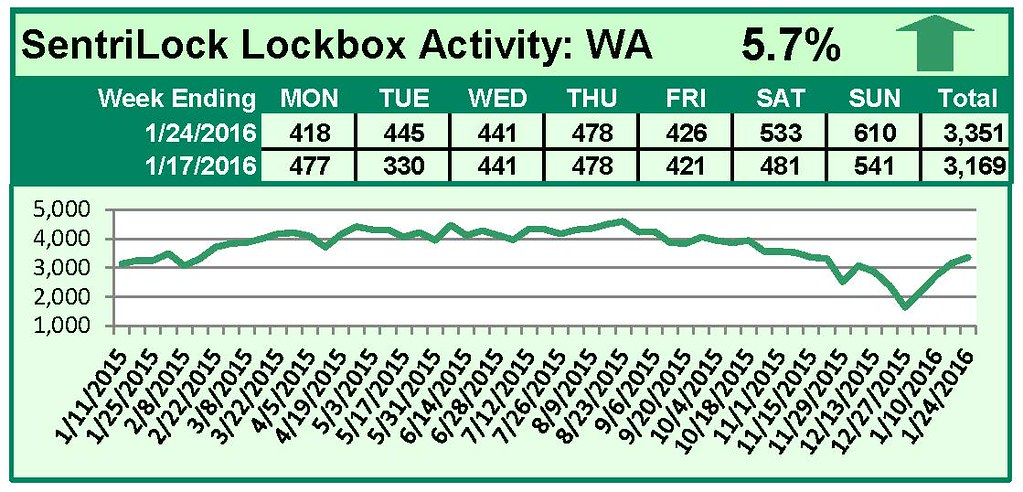
This Week’s Lockbox Activity
For the week of January 18-24, 2016, these charts show the number of times RMLS™ subscribers opened SentriLock lockboxes in Oregon and Washington. Activity in Oregon and Washington increased again this week.
For a larger version of each chart, visit the RMLS™ photostream on Flickr.
![2015 Distressed Residential Properties]()
by RMLS Communication Department | Jan 27, 2016
The chart below shows the number of bank owned/REO and short sales in all areas of the RMLS™ system during 2015.

All areas when comparing percentage share of the market 2014 to 2015:
• Comparing 2014 to 2015, distressed sales as a percentage of closed sales decreased from 10.4% to 8.8%.
• New listings increased from 68,291 to 73,624, which is a 7.8% increase.
• Short sales comprised 2.0% of new listings and 2.2% of sold listings in 2015, down 1.3% and 1.9% from 2014 respectively as a percentage of the market.
• Bank owned/REO properties comprised 5.6% of new listings and 6.6% of sales in 2015, increasing from 5.2% and 6.3%, respectively, in 2014.
Portland metro when comparing percentage share of the market 2014 to 2015:
• Comparing 2014 to 2015, distressed sales as a percentage of closed sales decreased from 8.6% to 7.4%.
• New listings rose from 37,283 to 40,427, which is a 8.4% increase.
• Short sales comprised 1.9% of new listings and 2.1% of sold listings in 2015, down 1.4% and 1.8% from 2014 respectively as a percentage of the market.
• Bank owned/REO properties comprised 4.8% of new listings and 5.3% of sales in 2015, increasing from 4.2% and 4.7%, respectively, in 2014.
Clark County when comparing percentage share of the market 2014 to 2015:
• Comparing 2014 to 2015, distressed sales as a percentage of closed sales decreased from 14.6% to 8.3%.
• New listings rose from 9,607 to 10,506, which is a 9.4% increase.
• Short sales comprised 2.9% of new listings and 3.0% of sold listings in 2015, down 1.8% and 3.2% from 2014 as a percentage of the market.
• Bank owned/REO properties comprised 3.5% of new listings and 5.3% of sales in 2015, decreasing from 5.8% and 8.4% respectively in 2014.
Below are links to additional charts for some of our larger areas:
Portland Metro Area
Clark County, WA
Lane County, OR
Douglas County, OR
Coos County, OR
If you want information on percentages of distressed sales in other areas not represented by our charts, please contact us at communications@rmls.com.
![2015 Distressed Residential Properties]()
by RMLS Communication Department | Jan 26, 2016

This chart shows the number of bank owned/REO properties and short sales in all areas of the RMLS™ system during the fourth quarter of 2015.
Below are links to additional charts for some of our larger areas.
• Portland Metro Area Distressed Properties (4th Quarter 2015)
• Clark County, WA Distressed Properties (4th Quarter 2015)
• Lane County, OR Distressed Properties (4th Quarter 2015)
• Douglas County, OR Distressed Properties (4th Quarter 2015)
• Coos County, OR Distressed Properties (4th Quarter 2015)
Here are some additional facts about distressed residential properties in the fourth quarter of 2015:
All areas when comparing percentage share of the market, fourth quarter to third quarter 2015:
• When comparing fourth quarter to third quarter 2015, distressed sales as a percentage of new listings increased by 3.7% (10.1 v. 6.4%).
• In a comparison of fourth quarter to third quarter 2015, distressed sales as a percentage of closed sales increased by 0.9% (8.5 v. 7.6%).
• Short sales comprised 2.2% of new listings and 1.7% of sales in the fourth quarter, up 0.7% and down 0.2% from the third quarter of 2015, respectively.
• Bank owned/REO properties comprised 7.9% of new listings and 6.8% of sales in the fourth quarter, up 3.0% and 1.1% from the third quarter of 2015, respectively.
Portland metro when comparing percentage share of the market, fourth quarter to third quarter 2015:
• When comparing fourth quarter to third quarter 2015, distressed sales as a percentage of new listings increased by 3.8% (9.2 v. 5.4%).
• In a comparison of fourth quarter to third quarter 2015, distressed sales as a percentage of closed sales increased by 1.3% (7.7 v. 6.4%).
• Short sales comprised 2.1% of new listings and 1.8% of sales in the fourth quarter, up 0.7% and 0.1% from the third quarter of 2015, respectively.
• Bank owned/REO properties comprised 7.1% of new listings and 5.9% of sales in the fourth quarter, up 3.1% and 1.2% from the third quarter of 2015, respectively.
Clark County when comparing percentage share of the market, fourth quarter 2015 to third quarter 2015:
• When comparing fourth quarter to third quarter 2015, distressed sales as a percentage of new listings increased by 2.0% (7.0 v. 5.0%).
• In a comparison of fourth quarter to third quarter 2015, distressed sales as a percentage of closed sales decreased by 0.3% (6.0 v. 6.3%).
• Short sales comprised 3.4% of new listings and 1.9% of sales in the fourth quarter, up 1.5% for new listings and down 0.7% for sales when compared to the third quarter of 2015, respectively.
• Bank owned/REO properties comprised 3.6% of new listings and 4.1% of sales in the fourth quarter, up 0.5% and 0.4% from the third quarter of 2015, respectively.
If you’d like more information or percentages of distressed residential sales in other areas not represented by our charts, please contact us at communications@rmls.com.
by RMLS Communication Department | Jan 25, 2016
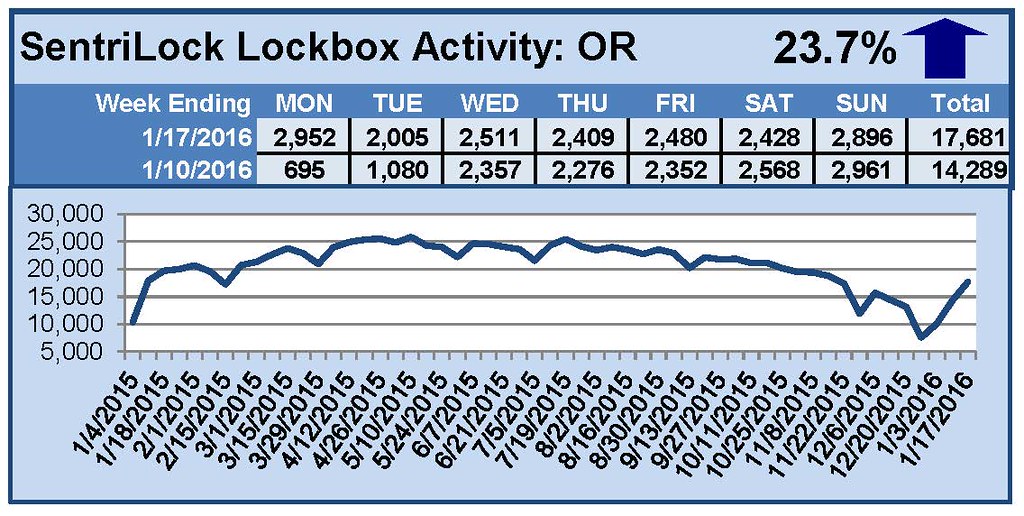
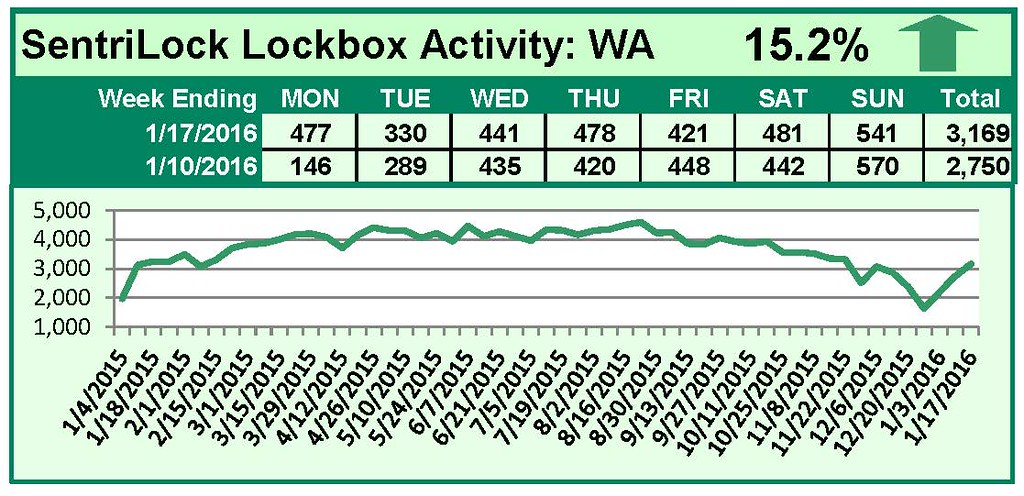
This Week’s Lockbox Activity
For the week of January 11-17, 2016, these charts show the number of times RMLS™ subscribers opened SentriLock lockboxes in Oregon and Washington. Activity in Oregon and Washington increased again this week.
For a larger version of each chart, visit the RMLS™ photostream on Flickr.
![2015 Distressed Residential Properties]()
by RMLS Communication Department | Jan 22, 2016
Are you ready to connect with fellow REALTORS® more easily using RMLSweb? RMLS™ is about to unleash improvements to the RMLSweb roster designed to make your work easier!
In August, the RMLS™ Board of Directors voted to integrate links from RMLS™ websites to REALTOR® agent profiles on Realtor.com. On Thursday, January 28th, RMLS™ will debut the first step in this process when it releases some improvements to RMLSweb roster pages.
Agent Full Reports

While viewing an Agent Full report on RMLSweb, clicking the agent’s name will open a pop-up displaying the broker’s roster information, including a link to their Realtor.com profile. Roster information will also include the license number of both the agent and their office. RMLS™ has added these fields so subscribers may find this information easily for use in various transaction documents.
Once these improvements are live, subscribers should double-check their license number and other information displayed in the roster. If the license number displayed is incorrect, contact the RMLS™ Front Desk for assistance.
Agent or Office Search
 Looking for contact information for a specific agent or office? Use the MLS Roster tab on RMLSweb to search for an agent or office. Subscribers may now search for agents by language, designation, or email address!
Coming ahead, RMLS.com—the RMLS™ website for consumers to browse listings—will see the Find a REALTOR® feature improved as well. Consumers coming to the site will be able to find REALTORS® based on the current criteria with added languages and designations. Links to Realtor.com profiles will be available for prospective clients as well.
Don’t have your Realtor.com profile set up yet? Head over to the REALTOR® profile page quick start guide and get set up today!