by RMLS Communication Department | Dec 10, 2009
Will new restrictions slow the increase in FHA popularity?
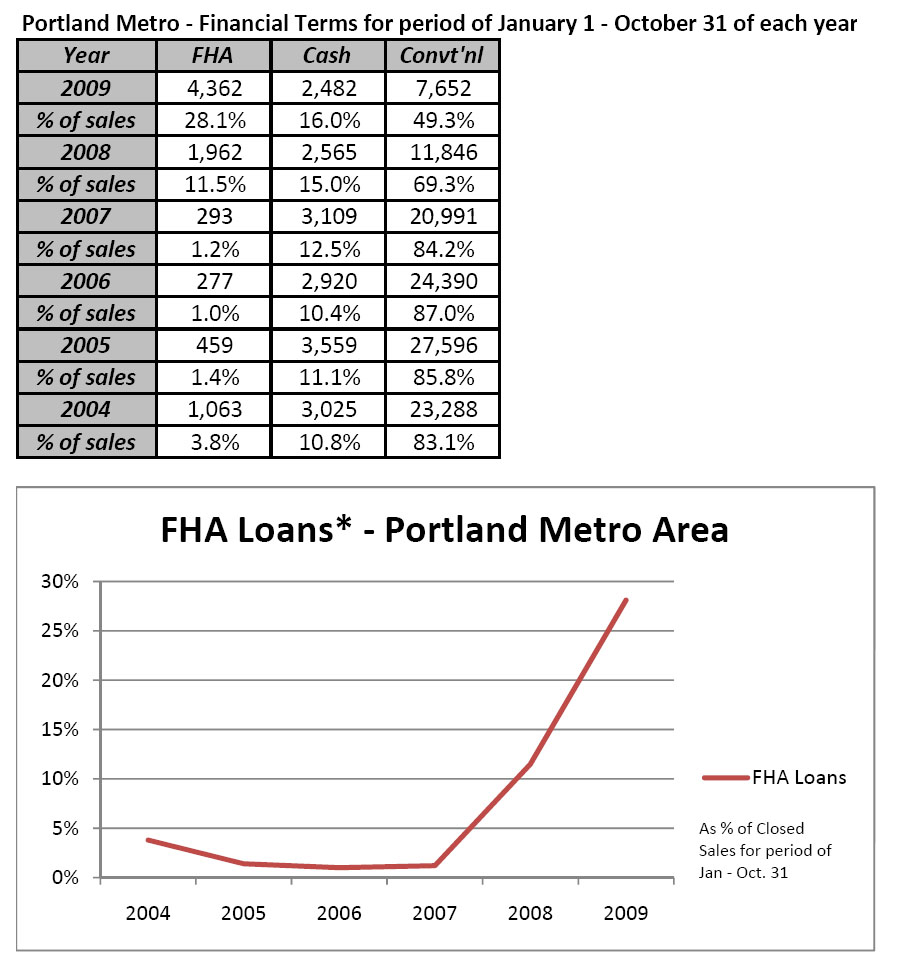
We all know that FHA Loans have increased in the past few years with the changing market, but how much? I recently ran some numbers on financial terms, a required field in RMLSweb, that may shed some light. These numbers are for the Portland metro area (Clackamas, Columbia, Multnomah, Washington and Yamhill counties).

As you can see, sold listings with the financial terms “FHA” have increased in the RMLS Portland market area from just 1.2% in 2007 to 28.1% of sales through October 2009. These numbers are closely in line with national levels; a recent report stated that FHA loans are up to 30% this year from 3% in 2006.
Do you think we’ll continue to see FHA loans grow in popularity, or will it change if plans to make some FHA loans require a down payment higher than 3.5% go through? Realtors, let us know what you’re seeing out in the field – leave a comment below.
by RMLS Communication Department | Nov 20, 2009
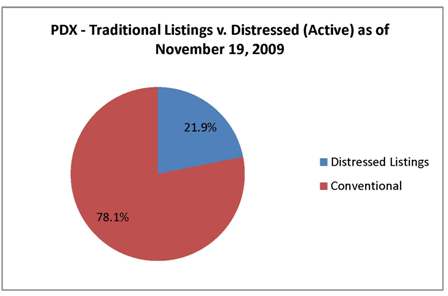
21.9% of listings distressed in PDX, 31.7% in Clark County
The latest report from the Mortgage Bankers Association indicated that the rate of foreclosure for people with fixed rate loans and good credit is on the rise.
The AP reports that homeowners’ inability to keep up with payments is now more due to unemployment, rather than the subprime loans that contributed to the initial increase in foreclosures.
A quick search on RMLSweb reveals that in the Portland Metro area, distressed properties currently make up 21.9% of active residential listings (this number takes into account listings that require third-party approval, as this typically indicates a short sale and those that are marked as bank-owned).

In Clark County, 31.7% of residential listings are distressed.

by RMLS Communication Department | Nov 13, 2009
Same-month sales up nearly across the board in Oregon & Southern Washington
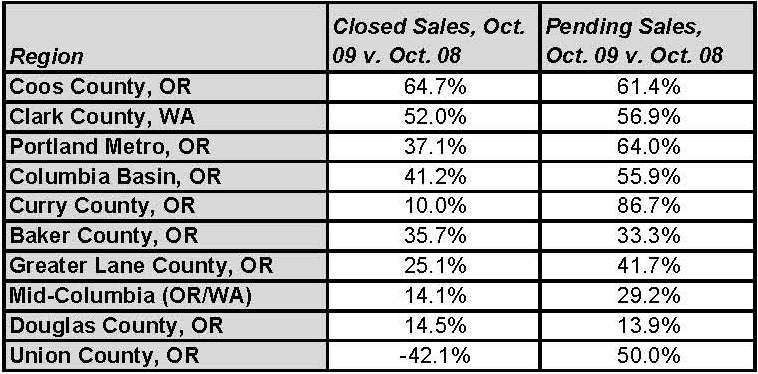
Sales activity continued to outpace levels from the same month last year in the latest RMLS™ Market Action report. Inventory was also down in several areas, including Lane County, Portland and Clark County.
Sales Activity:
Both pending and closed sales increased in 9 out of 10 of the regions that we cover when compared to the same month in 2008. The Portland metro area saw its largest increase in closed sales since January 2005 , which was also the highest total of closed sales since August 2007. Clark County set a record for pending sales, with an increase of 56.9% compared to last October. Here’s a recap of each region’s same-month sales activity:

It will be interesting to see if this trend of increased sales activity will continue this fall and winter season. The percentage increases were not surprising this month, given the recent strength in sales and considering that last year we saw sales begin to drop in October, kicking off a stretch of slow sales activity that would extend into the first quarter of 2009.
Inventory:
Housing inventory levels dropped in several key areas, including Lane County (6.2 months), Portland (6.5 months, lowest since August 2007) and Clark County (6.4 months, lowest since September 2006). This is somewhat counterintuitive, as inventory levels have often increased as we head into the slower fall and winter seasons. But, considering the following factors, it’s no surprise:
- Low interest rates
- New listings continue to drop in most areas, reducing the supply of homes available
- The perceived tax credit deadline (which has since been extended)
- Lower home prices
What do you think?
Realtors – what do you think? Where do you see the market heading? Have you heard increased interest from buyers and sellers since the tax credit extension/expansion? Comment below!
by RMLS Communication Department | Oct 23, 2009
Homes below $400k make up 85% of sales in September
I recently read that in Phoenix, 93% of September Home Sales were below $400k. The author says that Phoenix is essentially a “tale of two markets”, one where homes in the lower priced spectrum are selling & where high-end homes are sitting.
We’ve looked at similar numbers before to see how the homebuyer tax credit was effecting the Portland market, so I figured it was time to take a look at these numbers again & see how we compare to the Phoenix sales by price range – here’s what I found:
% of Portland Home Sales by Price Range (September 2009)
|
Sept. 2009 |
% of Sales |
Sept. 2008 |
% of Sales |
| $0-$150k |
190 |
10.4% |
115 |
6.6% |
| $150-$200k |
383 |
20.9% |
235 |
13.6% |
| $200k-$250k |
416 |
22.7% |
420 |
24.3% |
| $250k-$400k |
569 |
31.0% |
633 |
36.6% |
| $400k-$500k |
142 |
7.7% |
170 |
9.8% |
| $500k-$750k |
96 |
5.2% |
114 |
6.6% |
| $750k – $1 million + |
38 |
2.1% |
44 |
2.5% |
|
|
% of Sales by Price Range, Combined (September 2009)
|
Sept. 09 |
Sept. 08 |
| Below $250k |
53.9% |
44.5% |
| Below $400k |
85.0% |
81.1% |
| Above $500k |
7.3% |
9.1% |
As you can see, not quite as high as Phoenix, but still 85% of sales in Portland were below $400k, which is up about 4% from last September.
Also note that sales below $250k are up 9.4% from last September. I suspect a lot of those sales can be attributed to the $8,000 tax credit (although some investors may also be cashing in on some lower priced homes as well).
The tax credit is set to expire on November 30, and the debate rages on in Washington over its extension. It seems to have given the market here a boost, so it will be interesting to see how the market fares if/when it expires.
If the tax credit does indeed expire, it would still take a lot for things to get worse this winter compared to last year. Last January we saw sales activity drag to the lowest total in the Portland metro area that we had seen since RMLS™ began keeping records in 1992.
What do you think? Did the tax credit help? Should it be extended? Leave a comment, we’d love to hear your opinion!
by RMLS Communication Department | Oct 16, 2009
Residential real estate sales tick up in several areas, inventory down
This month’s RMLS™ Market Action report showed a trend of increasing real estate sales & subsequently lower housing inventory in many areas of Oregon & Southwest Washington.
Sales Activity:
Closed sales rose in the following areas this month, compared to the same month in 2008:
| Area |
Closed Sales |
| Curry County, Oregon |
100% |
| Columbia Basin, Oregon |
36.6% |
| Lane County, Oregon |
23.2% |
| Clark County, Washington |
20.2% |
| Portland Metro, Oregon |
9.8% |
Third Quarter Sales Up:
September marked the end of the third quarter and compared to Q3 in 2008, Coos County, Curry County, Douglas County, Lane County, Portland and Clark County all saw sales outpace Q3 in 2008. Clark County led the pack at a clip of 18.7%.
Inventory:
Ten of eleven areas that we cover in the Market Action report saw housing inventory drop from August. This can be attributed to rising sales in several areas and as we head into the slower fall & winter seasons, fewer homes are being listed as well.
Both the Portland and Clark County areas saw inventory drop to 7.6 months. Lane County has the lowest inventory of the areas we cover at 6.8 months.
by RMLS Communication Department | Sep 28, 2009
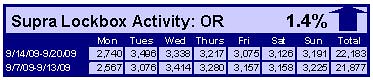
Lockbox Activity Down In Washington, Up In Oregon
When comparing the week of September 14-20 with the week prior, the number of times an RMLS subscriber opened a Supra lockbox decreased 1.2% in Washington and increased 1.4% in Oregon.
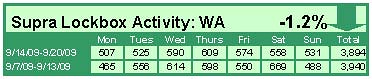

Click the chart for a larger view (Washington, top; Oregon, bottom)
Archive
View an archive of the Supra lockbox statistical reports on Flickr.