![2012 Distressed Residential Properties]()
by RMLS Communication Department | Jan 24, 2013
The chart below shows the number of bank owned/REO and short sales in all areas of the RMLS™ system during 2012.

All areas when comparing percentage share of the market 2011 to 2012:
• Comparing 2011 to 2012, distressed sales as a percentage of closed sales decreased from 33.5% to 28.6%.
• New listings dropped from 61,980 to 58,280 which is a 5.9% decrease.
• Short sales comprised 11.3% of new listings and 12.1% of sold listings in 2012, down 2.6% and up 1.4% from 2011 respectively as a percentage of the market.
• Bank owned properties comprised 10.3% of new listings and 16.5% of sales in 2012, decreasing slightly from 13.1% and 22.8% respectively in 2011.
Portland metro when comparing percentage share of the market 2011 to 2012:
• Comparing 2011 to 2012, distressed sales as a percentage of closed sales decreased from 33.1% to 28.2%.
• New listings dropped from 33,940 to 32,011 which is a 5.6% decrease.
• Short sales comprised 12.1% of new listings and 12.3% of sold listings in 2012, down 3.2% and up 1.5% from 2011 respectively as a percentage of the market.
• Bank owned properties comprised 10.4% of new listings and 15.9% of sales in 2012, decreasing slightly from 13.4% and 22.3% respectively in 2011.
Clark County when comparing percentage share of the market 2011 to 2012:
• Comparing 2011 to 2012, distressed sales as a percentage of closed sales decreased from 43.2% to 32.2%.
• New listings dropped from 8,643 to 7,280 which is a 15.7% decrease.
• Short sales comprised 19.1% of new listings and 18.5% of sold listings in 2012, down 1.9% and up 2.1% from 2011 respectively as a percentage of the market.
• Bank owned properties comprised 8.8% of new listings and 13.7% of sales in 2012, decreasing from 15.9% and 26.8% respectively in 2011.
Below are links to additional charts for some of our larger areas:
Portland Metro
Clark County, WA
Lane County, OR
Douglas County, OR
Coos County, OR
If you want information on percentages of distressed sales in other areas not represented by our charts, please contact us at communications@rmls.com.
![2012 Distressed Residential Properties]()
by RMLS Communication Department | Jan 21, 2013
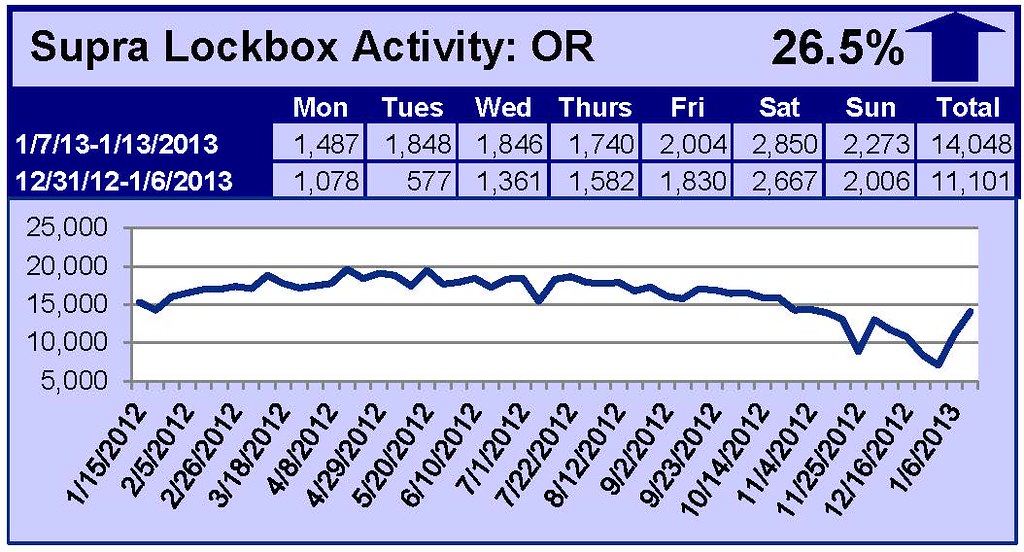 This Week’s Lockbox Activity
For the week of January 7-13, 2013, these charts show the number of times RMLS™ subscribers opened Supra lockboxes in Oregon and Washington. The numbers in Oregon and Washington kept rising this week.
For a larger version of each chart, visit the RMLS™ photostream on Flickr.
![2012 Distressed Residential Properties]()
by RMLS Communication Department | Jan 18, 2013

This chart shows the number of bank owned properties and short sales in all areas of the RMLS™ system during the fourth quarter of 2012.
Below are links to additional charts for some of our larger areas.
• Portland Metro Distressed Properties (4th Quarter 2012)
• Clark County, WA Distressed Properties (4th Quarter 2012)
• Lane County, OR Distressed Properties (4th Quarter 2012)
• Douglas County, OR Distressed Properties (4th Quarter 2012)
• Coos County, OR Distressed Properties (4th Quarter 2012)
Here are some additional facts about distressed residential properties in the fourth quarter of 2012:
All areas when comparing percentage share of the market, fourth quarter 2012 to third quarter 2012:
• When comparing the fourth quarter of 2012 to the third quarter, distressed sales as a percentage of new listings increased by 3.2% (21.4% v. 18.2%).
• In a comparison of the fourth quarter of 2012 to the third quarter, distressed sales as a percentage of closed sales decreased by 1.2% (23.6% v. 24.8%).
• Short sales comprised 11.3% of new listings and 11.9% of sales in the fourth quarter of 2012, up 1.5% and down .3% from the third quarter of 2012, respectively.
• Bank owned/REO properties comprised 10.1% of new listings and 11.7% of sales in the fourth quarter of 2012, up 1.7% and down .9% from the third quarter of 2012, respectively.
Portland Metro when comparing percentage share of the market, fourth quarter 2012 to third quarter 2012:
• When comparing the fourth quarter of 2012 to the third quarter, distressed sales as a percentage of new listings increased by 2.6% (21.1% v. 18.5%).
• In a comparison of fourth quarter 2012 to third quarter, distressed sales as a percentage of closed sales decreased by 1.4% (22.8% v. 24.2%).
• Short sales comprised 12.0% of new listings and 12.3% of sales in the fourth quarter of 2012, up 1.8% and down .2% from the third quarter of 2012, respectively.
• Bank owned/REO properties comprised 9.1% of new listings and 10.5% of sales in the fourth quarter of 2012, up .8% and down 1.2% from the third quarter of 2012, respectively.
Clark County when comparing percentage share of the market, fourth quarter 2012 to third quarter 2012:
• When comparing the fourth quarter of 2012 to the third quarter, distressed sales as a percentage of new listings increased by 2.1% (26.7% v. 24.6%).
• In a comparison of fourth quarter 2012 to third quarter 2012, distressed sales as a percentage of closed sales decreased by 1.0% (28.8% v. 29.8%).
• Short sales comprised 17.8% of new listings and 18.6% of sales in the fourth quarter of 2012, up .6% for new listings and down 1.5% for sales when compared to the third quarter of 2012, respectively.
• Bank owned/REO properties comprised 8.9% of new listings and 10.2% of sales in the fourth quarter of 2012, up 1.5% and .5% from the third quarter of 2012, respectively.
If you’d like more information or percentages of distressed residential sales in other areas not represented by our charts, please contact us at communications@rmls.com.
![2012 Distressed Residential Properties]()
by RMLS Communication Department | Jan 14, 2013
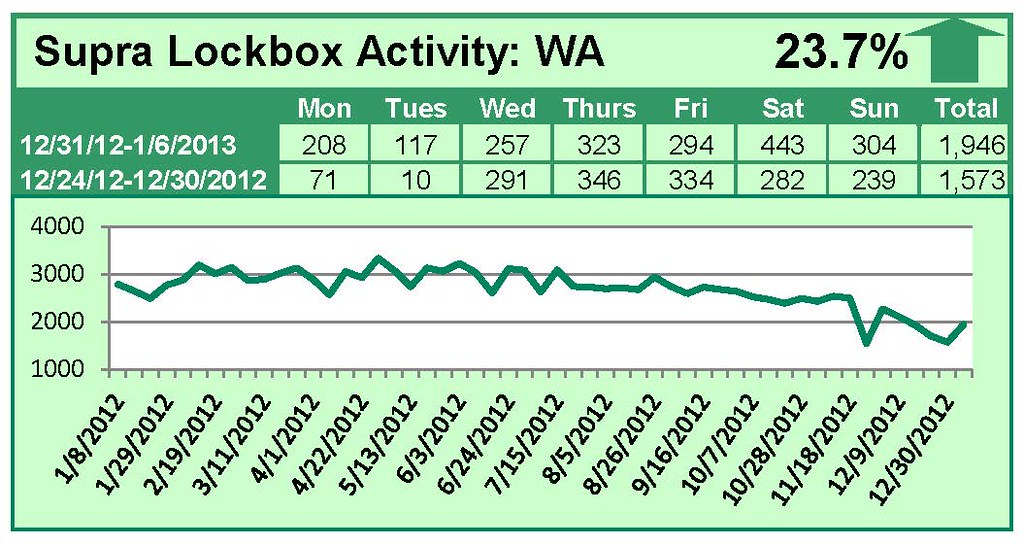 This Week’s Lockbox Activity
For the week of December 31, 2012 to January 6, 2013, these charts show the number of times RMLS™ subscribers opened Supra lockboxes in Oregon and Washington. The numbers in Oregon and Washington rose significantly this week.
For a larger version of each chart, visit the RMLS™ photostream on Flickr.
![2012 Distressed Residential Properties]()
by RMLS Communication Department | Jan 7, 2013
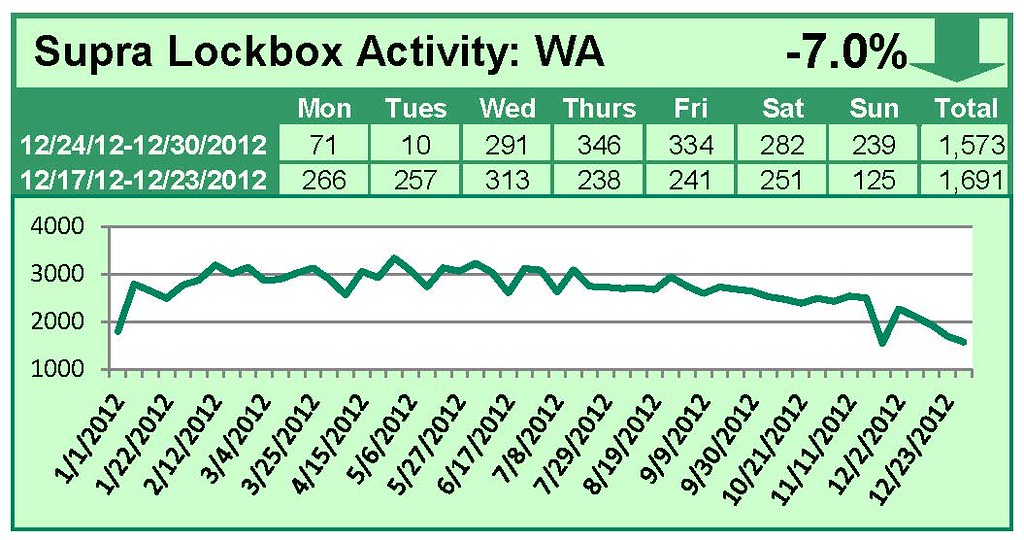 This Week’s Lockbox Activity
For the week of December 24-30 2012, these charts show the number of times RMLS™ subscribers opened Supra lockboxes in Oregon and Washington. The numbers in Oregon and Washington fell again this week.
For a larger version of each chart, visit the RMLS™ photostream on Flickr.
![2012 Distressed Residential Properties]()
by RMLS Communication Department | Dec 31, 2012
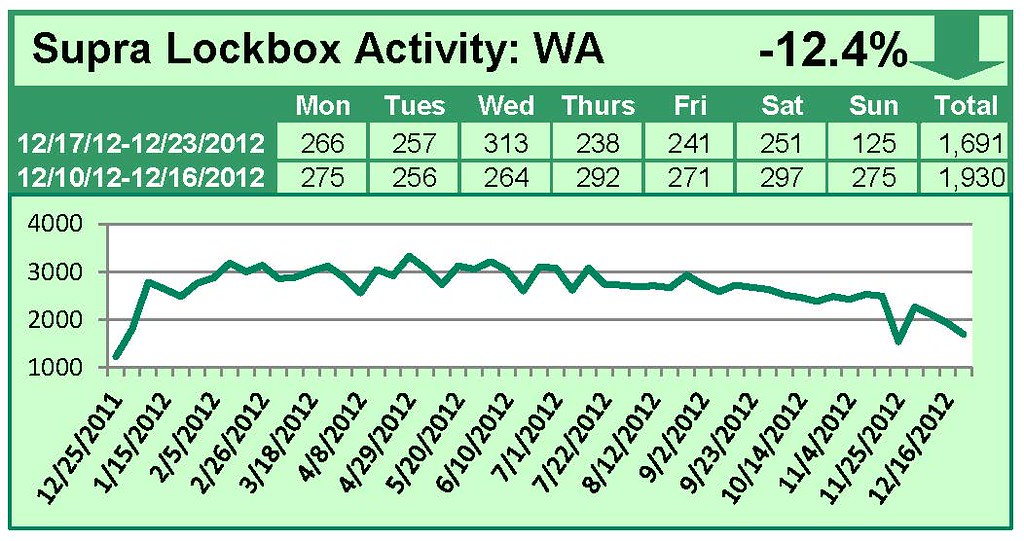 This Week’s Lockbox Activity
For the week of December 17-23 2012, these charts show the number of times RMLS™ subscribers opened Supra lockboxes in Oregon and Washington. The numbers in Oregon and Washington fell again this week.
For a larger version of each chart, visit the RMLS™ photostream on Flickr.
