
by RMLS Communication Department | Jan 14, 2010
Real estate activity in Oregon and SW Washington up in most RMLS areas
In the December 2009 RMLS™ Market Action report, sales activity was up in most areas that we cover, compared to December 2008. Though this is a positive sign, it should be taken with a grain of salt, because last December brought record lows for pending and closed sales in many areas.
Portland saw a 52.6% increase in closed sales this month and a 40.9% increase in pending listings, while Clark County closed sales were up 48.1%, and pending sales rose 33.8%. Baker County, Coos County, Curry County, Lane County, the Mid-Columbia region and Union County also saw both closed and pending sales increase over last December.
Sales volume down for the year in most areas

Given lower sales totals and lower prices, this should come as no surprise, but total sales volume for the year fell in most areas in 2009. Portland dropped from $6.3 billion in 2008 to $5.5 billion this year. Lane County was down from $740 million in 2008 to $669 million in 2009.
Notable, however, is an increase in sales volume in Curry County – up to $66 million this year from $59 million in 2008. And Clark County matched its total sales volume of $1.2 billion in 2008.
Year-end stats, Clark County shines
Clark County seems to be ahead of the pack when it comes to sales activity. For the year, pending sales were up 19.5% and closed sales up 13.8% compared to 2008. That’s far ahead of most areas; for example, in Portland, pending sales were up 4%, and closed sales were down 0.9%. Only Curry County outpaced Clark County in percentage of sales increase for 2009, with pending sales up 31.3% and closed sales up 23.7%.
However, the increase in sales has come at a price – Clark County saw the largest decrease (-12.6%) in median sale price for the 11 areas we cover.
by RMLS Communication Department | Jan 11, 2010
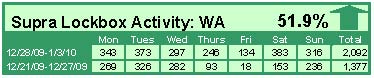
RMLS Subscriber Supra Lockbox Activity – Updated Through Week of Dec. 28-Jan. 3
When comparing the week of December 28 – January 3 with the week prior, the number of times an RMLS™ subscriber opened a Supra lockbox increased 51.9% in Washington and 59.2% in Oregon.

Click the chart for a larger view
Archive
View an archive of the Supra lockbox statistical reports on Flickr.
by RMLS Communication Department | Jan 4, 2010
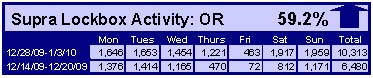
House Hunters Take Time to Enjoy the Festivities
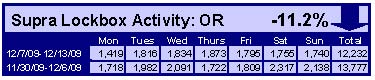
When comparing the week of December 21-27 with the week prior, the number of times an RMLS™ subscriber opened a Supra lockbox decreased 41.5% in Washington and 42.9% in Oregon.


Click the chart for a larger view
Archive
View an archive of the Supra lockbox statistical reports on Flickr.
by RMLS Communication Department | Dec 28, 2009
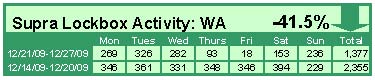
Activity Falls, Potential House Hunters Still Busy With Holidays
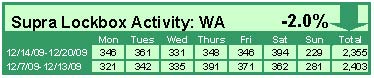
When comparing the week of December 14 – 20 with the week prior, the number of times an RMLS™ subscriber opened a Supra lockbox decreased 2% in Washington and 7.2% in Oregon.

Click the chart for a larger view
Archive
View an archive of the Supra lockbox statistical reports on Flickr.
by RMLS Communication Department | Dec 21, 2009
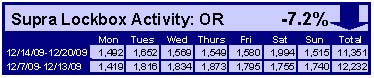
Activity Dips; Perhaps House Hunters Were Holiday Gift Shopping Instead
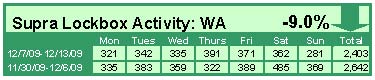
When comparing the week of December 7 – 13 with the week prior, the number of times an RMLS™ subscriber opened a Supra lockbox decreased 9% in Washington and 11.2% in Oregon.

Click the chart for a larger view
Archive
View an archive of the Supra lockbox statistical reports on Flickr.
by RMLS Communication Department | Dec 15, 2009
Sales up, but in comparison to a dismal month last November
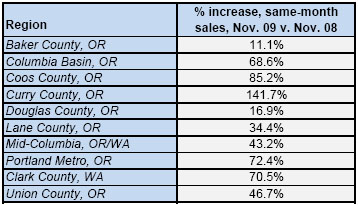
The big highlight this month for many areas is a large jump in closed sales compared to last November. Curry County posted a 141.7% increase and Portland and Clark County set records for percentage increases in same-month sales at 72.4% and 70.5%, respectively.

While these stats are obviously a good sign for market activity, continue to keep in mind that last year we were at the height of the economic crisis and we hit some of the lowest points in sales totals in recent years. So, yes, sales are way up compared to last year, but remember that we’re comparing it to unusually low sales totals.
Has the winter slowdown arrived?
Closed sales had been on the rise in many key areas month-to-month through October, but it appears that the winter slowdown has arrived. Compared to this October, pending and closed sales were down in most areas, including Columbia Basin, Douglas County, Lane County, the Mid-Columbia region, Portland and Clark County.
Inventory up
Inventory ticked up in every area except Curry County and Union County, however, most areas are well below last year’s inventory levels thanks to fewer listings entering the market and higher sales totals. For example, Portland’s inventory stands at 7.1 months – 53% less than last November’s 15 months of inventory.