by RMLS Communication Department | Oct 16, 2009
Residential real estate sales tick up in several areas, inventory down
This month’s RMLS™ Market Action report showed a trend of increasing real estate sales & subsequently lower housing inventory in many areas of Oregon & Southwest Washington.
Sales Activity:
Closed sales rose in the following areas this month, compared to the same month in 2008:
| Area |
Closed Sales |
| Curry County, Oregon |
100% |
| Columbia Basin, Oregon |
36.6% |
| Lane County, Oregon |
23.2% |
| Clark County, Washington |
20.2% |
| Portland Metro, Oregon |
9.8% |
Third Quarter Sales Up:
September marked the end of the third quarter and compared to Q3 in 2008, Coos County, Curry County, Douglas County, Lane County, Portland and Clark County all saw sales outpace Q3 in 2008. Clark County led the pack at a clip of 18.7%.
Inventory:
Ten of eleven areas that we cover in the Market Action report saw housing inventory drop from August. This can be attributed to rising sales in several areas and as we head into the slower fall & winter seasons, fewer homes are being listed as well.
Both the Portland and Clark County areas saw inventory drop to 7.6 months. Lane County has the lowest inventory of the areas we cover at 6.8 months.
by RMLS Communication Department | Sep 15, 2009
The latest edition of Market Action is now available to RMLS™ subscribers on
RMLSweb. To view the latest reports, log on to RMLS
web and under the links section on the left side, there is a link that says “Latest Market Action” in
red. A new window should open with all of the latest reports.
If you’re not an RMLS™ subscriber, but would like to see the latest Market Action report for your area, feel free to contact a Realtor® who is an RMLS™ subscriber and they can provide you with the report and further insight into local market conditions.
Stay tuned, as we will offer a few market highlights on the blog tomorrow!
by RMLS Communication Department | Aug 13, 2009
We released the latest Market Action reports to RMLS™ subscribers yesterday. Many areas of Oregon and Southwest Washington are showing improvement as far as sales and inventory go – here are a few highlights:

Portland Metro Active Listings: Note how the 2009 line is basically flat.
Inventory: Inventory is showing steady improvement in Portland (7.3 months), Clark County (7.3 months), and Lane County (6.2 months). In most circles, 6 months of supply is considered a balanced market. The drop in inventory comes thanks to strong closed sales, but also because the number of active listings is growing at a much slower pace than usual.
Closed sales: The Portland metro area was finally able to post a gain in same-month closed sales for the first time since April 2007. Closed sales were up 8.6% compared to last July. Clark County posted a gain for the second straight month – closed sales were up 23.5% there. Lane County also posted an 11% gain. Baker County, Curry County, Douglas County, and the Mid-Columbia region also saw growth.

Clark Co. Pending Sales: Oh, so close to reaching July 2007 levels.
Pending sales: Same-month pending sales in Clark County grew for the fourth month in a row at 30.3%. In fact, Clark County pending sales not only surpassed July 2008 levels, but they came close to hitting July 2007 levels. With the exception of the Mid-Columbia region and Union County, same-month pending sales grew in all of our primary service areas.
by RMLS Communication Department | Jul 16, 2009
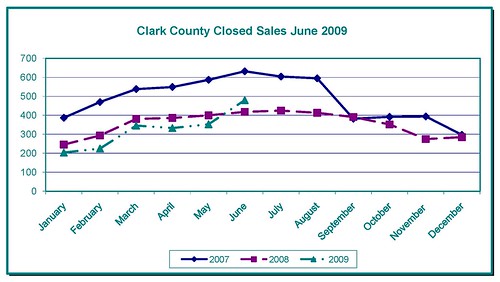
The latest issue of the RMLS™ Market Action for June 2009 shows increases in accepted offers, closed sales and a decrease in inventory in several regions.
Accepted Offers
The five county Portland Metro Area saw a month-over-month increase in pending sales (8.4% comparing June 2009 with June 2008) for the first time since December 2006. Pending sales also increased for the third month in a row in Clark County, Washington. The following regions also saw an increase in pending listings in June 2009: Coos, Curry, Douglas, Lane, Mid-Columbia and Union.
Closed Sales
Closed sales in Clark County increased14.8% comparing June 2009 with June 2008. This is the first increase since September 2008.

The following regions also experienced increases in closed sales: Columbia Basin, Curry, Douglas and Mid-Columbia.
Inventory
Inventory in all three of our largest service areas (Portland Metro, Clark County and Lane County) dipped to the lowest it’s been since August 2007. In addition, the following counties experienced drops in inventory from the previous month: Columbia Basin, Coos, Curry and Douglas.
by RMLS Communication Department | Jun 11, 2009
Rumor has it that first time buyers (thanks to the $8000 tax credit) and investors are making the bulk of home purchases these days. Like all savvy shoppers, I’m sure they want to make sure they are getting a good deal.
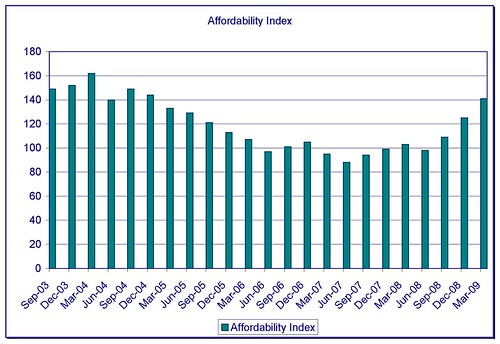
While, ultimately this is extremely personal calculation (because it depends on the buyer’s income, mortgage rates, how well the house will meet their needs, etc.) there is one generic indicator that we can use to get a sense of where the market is at overall: the Affordability Index.

This graph shows the affordability index for the Portland Metro Area by quarter since Sept. 2003.
According to our calculations (which are based on a formula we got from the National Association of Realtors a while back) houses have been becoming increasingly more affordable since September 2008. But what does that mean?
Let’s look at the index rating for April, which was 1.41 (see graph above). In theory, someone making the median family income $70,000 according to HUD (surprisingly it’s up this year) would earn 41 percent more money than they would need to be able to afford the monthly payment on the median priced home in the Portland Market ($246, 400 according to the April 2009 Portland Market Action–of course).
That is IF they got a loan at the 4.81 percent average interest rate per Freddie Mac in April AND they had a 20 percent down payment (which we all know isn’t all that common for first time home buyers these days).
Question is: what will happen now that interest rates are starting to creep back up? We’ll let you know in the July issue of Market Action—that’s the next time we calculate and report affordability in the newsletter.