Agents: How Upcoming Map Upgrades Can Help You
I think one of the coolest things about our upcoming release for mapping on RMLSweb is that you’ll be able to save custom Map Ranges & use them in several different searches (including Advanced Search, Hotsheet Search, Open House Search, Broker/MLS Tour Search, Actual Expired Search and Prospecting).
What does that mean to you, though? I think it will mean different things to different agents, but here’s one scenario:
You have buyers that absolutely want to buy in a particular neighborhood, let’s say St. Johns in Portland. You can set up a Prospecting profile for them and draw the custom map around JUST that area. Now the Prospecting results will only send them listings from the St. Johns neighborhood (as you define it).
Your buyers then find the house of their dreams. They’re ready to put in an offer. Since you’ve saved your Map Range for St. John’s, you can now use it to find comparables through Advanced Search when you are putting together the offer.
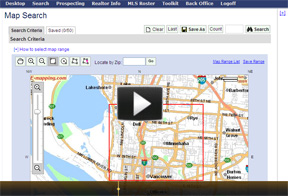
Here’s a quick demonstration from John Ayers, our Help Desk Manager:
To schedule a training session on this new release, call your local RMLS™ office, or e-mail training@rmls.com.

Pending Sales Continue to Increase in Clark County
One of the most interesting statistics I saw in the latest issues of Market Action was the increase of pending sales compared to May 2008 in Clark County. This was the second month in a row that the number of pending sales rivaled that of the same time period a year ago. This is good news! But what caught me by surprise was that the number of closed sales is still down from the same time a year ago.
So I started to wonder:
1) On average how long does it take for pending listings to show up as sold? According to the National Association of Realtors® pending home sales typically “become existing-home sales one-to-two months later.”
2) What percentage of accepted offers fail these days? Using a formula that I got from my new friend Chuck Reiling, a real estate professional in Seattle, WA, I took a stab at calculating the fallouts for properties in Clark County.
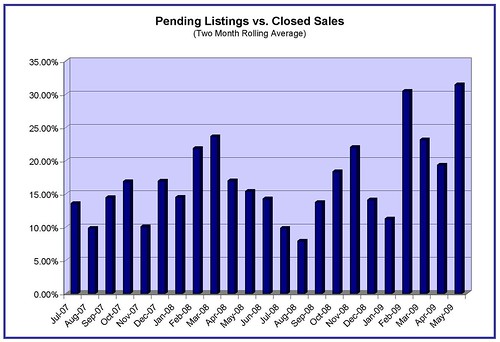
Following Chuck’s formula I looked at the pending listings monthly from May 1, 2007 to May 31, 2009 and the closed sales from June 1, 2007 to May 31, 2009. Like Chuck I staggered the pendings by one month to allow for a “typical” close time and I used a two month running average to adjust for variances.
Here’s a graph of the ratios:
The average pending vs. closed sale ratio is 17 percent. You’ll notice that the last few months have all been above that rate, with May 2009 coming in at 31.4 percent (the highest so far).
According to Eric Newman, a Mortgage Banker with Summit Mortgage Corp, these numbers may not actually reflect sale fails, but rather sale delays. Newman says that these days there are a number of factors that increase closing time, from waiting on bank approval when needed (approximate average of three weeks) to overwhelmed underwriters (current response time for FHA loans is around 21 days).
For example, I did a quick search in RMLSweb and discovered that out of the 552 properties that went pending in Clark County in April, approximately 117 were marked as requiring 3rd party approval (not all of these listings are short sales, but most of them are) and 122 were listed as bank owned. That’s almost half of the pending listings – 43 percent.
While it’s likely that a percentage of these more complicated transactions do fail, it also may be that these listings take longer to close so the typical one month lag may not apply. Newman says we would expect that most of those pending listings will probably not be recorded as closed until June because many loans are taking 45 to 60 days to close in the current market.
What do you think? What are you seeing out in the field?


