August Market Action Results Mixed
Same-month sales improve, but inventory rises in many areas

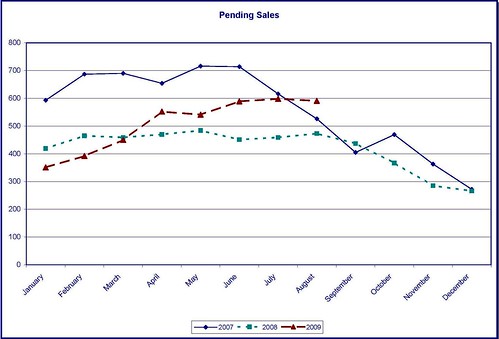
Pending sales in Clark County surpassed August 2008 & 2007 totals
Sales Activity
Sales activity (pending sales & closed sales) outpaced totals from last August in several areas. Clark County continues to post impressive numbers in this category, as pending sales were up 24.9% and closed sales increased 21.4%. Portland posted a 13% increase in pending sales and 4% in closed sales.
In Southern Oregon, Curry County saw a big jump in pending sales, a 75% increase over last August. Coos County, the Columbia Basin region and Baker County also saw pending and closed sales grow.
Housing Inventory
Inventory, on the other hand, rose in many areas this month. However, most of the increases were modest and inventory remains well below 2008 levels.
Portland saw inventory rise to 7.8 months, up from 7.3 in July, but was still 21% below where inventory was in August 2008. Clark County, similarly, was at 8 months in August, but that was 37% lower than August 2008, when inventory stood at 12.7 months.
Baker, Curry, Douglas & Lane counties and the Mid-Columbia region all saw inventory increase in August, but in all cases, it was still lower than 2008.
Days on Market
You may have noticed that this month we have comparable data for the “Total Market Time” (TMT) statistical category. This is the amount of time that it takes from when a property is listed to when an offer is accepted on that same property. If the property is re-listed within 31 days, TMT continues to accrue; however, it does not include the time that it was off the market.
We started tracking this stat in August 2008, so we finally had comparable data this month. As you may recall, we used to measure “Current Listing Market Time” instead, this measure was less accurate as it only tracked the amount of time that a listing was on the market, it did not track the property address (so if it was re-listed, it would reset).
Overall, it appears that it is taking more time to market properties, all of our market areas saw increases compared to last August, with the exception of the Columbia Basin region and Union County.
In Portland it took 135 days to sell a property, up 11.5% from last August when it took 121 days.


