by RMLS Communication Department | Oct 23, 2009
Homes below $400k make up 85% of sales in September
I recently read that in Phoenix, 93% of September Home Sales were below $400k. The author says that Phoenix is essentially a “tale of two markets”, one where homes in the lower priced spectrum are selling & where high-end homes are sitting.
We’ve looked at similar numbers before to see how the homebuyer tax credit was effecting the Portland market, so I figured it was time to take a look at these numbers again & see how we compare to the Phoenix sales by price range – here’s what I found:
% of Portland Home Sales by Price Range (September 2009)
|
Sept. 2009 |
% of Sales |
Sept. 2008 |
% of Sales |
| $0-$150k |
190 |
10.4% |
115 |
6.6% |
| $150-$200k |
383 |
20.9% |
235 |
13.6% |
| $200k-$250k |
416 |
22.7% |
420 |
24.3% |
| $250k-$400k |
569 |
31.0% |
633 |
36.6% |
| $400k-$500k |
142 |
7.7% |
170 |
9.8% |
| $500k-$750k |
96 |
5.2% |
114 |
6.6% |
| $750k – $1 million + |
38 |
2.1% |
44 |
2.5% |
|
|
% of Sales by Price Range, Combined (September 2009)
|
Sept. 09 |
Sept. 08 |
| Below $250k |
53.9% |
44.5% |
| Below $400k |
85.0% |
81.1% |
| Above $500k |
7.3% |
9.1% |
As you can see, not quite as high as Phoenix, but still 85% of sales in Portland were below $400k, which is up about 4% from last September.
Also note that sales below $250k are up 9.4% from last September. I suspect a lot of those sales can be attributed to the $8,000 tax credit (although some investors may also be cashing in on some lower priced homes as well).
The tax credit is set to expire on November 30, and the debate rages on in Washington over its extension. It seems to have given the market here a boost, so it will be interesting to see how the market fares if/when it expires.
If the tax credit does indeed expire, it would still take a lot for things to get worse this winter compared to last year. Last January we saw sales activity drag to the lowest total in the Portland metro area that we had seen since RMLS™ began keeping records in 1992.
What do you think? Did the tax credit help? Should it be extended? Leave a comment, we’d love to hear your opinion!
by RMLS Communication Department | Oct 19, 2009
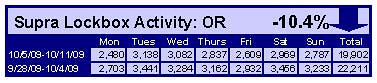
Activity Slides in Oregon & Washington
When comparing the week of October 5 – 11 with the week prior, the number of times an RMLS™ subscriber opened a Supra lockbox decreased 7.7% in Washington and 10.4% in Oregon.
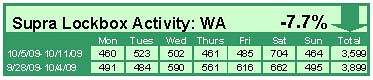

Click the chart for a larger view (Washington, top; Oregon, bottom)
Archive
View an archive of the Supra lockbox statistical reports on Flickr.
by RMLS Communication Department | Sep 15, 2009
The latest edition of Market Action is now available to RMLS™ subscribers on
RMLSweb. To view the latest reports, log on to RMLS
web and under the links section on the left side, there is a link that says “Latest Market Action” in
red. A new window should open with all of the latest reports.
If you’re not an RMLS™ subscriber, but would like to see the latest Market Action report for your area, feel free to contact a Realtor® who is an RMLS™ subscriber and they can provide you with the report and further insight into local market conditions.
Stay tuned, as we will offer a few market highlights on the blog tomorrow!
by RMLS Communication Department | Sep 14, 2009
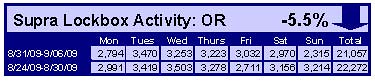
Lockbox Activity Down Over Labor Day Weekend
It appears some house hunters took a break to get in that last camping trip or to prepare their kids for school. In Washington, the number of times RMLS™ subscribers opened Supra lockboxes was down 8% when comparing the week of August 24-30 to the week of August 31-September 6. In Oregon activity was also down 5.5%.
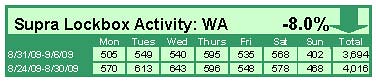

Click the chart for a larger view (Washington, top; Oregon, bottom)
Archive
View an archive of the Supra lockbox statistical reports on Flickr.
by RMLS Communication Department | Sep 8, 2009
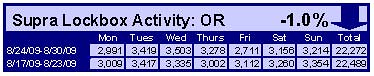
Washington Unchanged, Oregon Down Slightly
In Washington, the number of times RMLS™ subscribers opened Supra lockboxes was unchanged and in Oregon activity was down 1%. These stats reflect a comparison of the week of August 24-30 with the week of August 17-23.
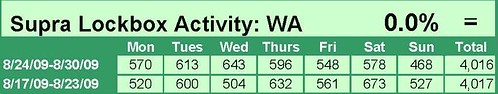

Click the chart for a larger view (Washington, top; Oregon, bottom)
Archive
View an archive of the Supra lockbox statistical reports on Flickr.