by RMLS Communication Department | Feb 24, 2014
This Week’s Lockbox Activity
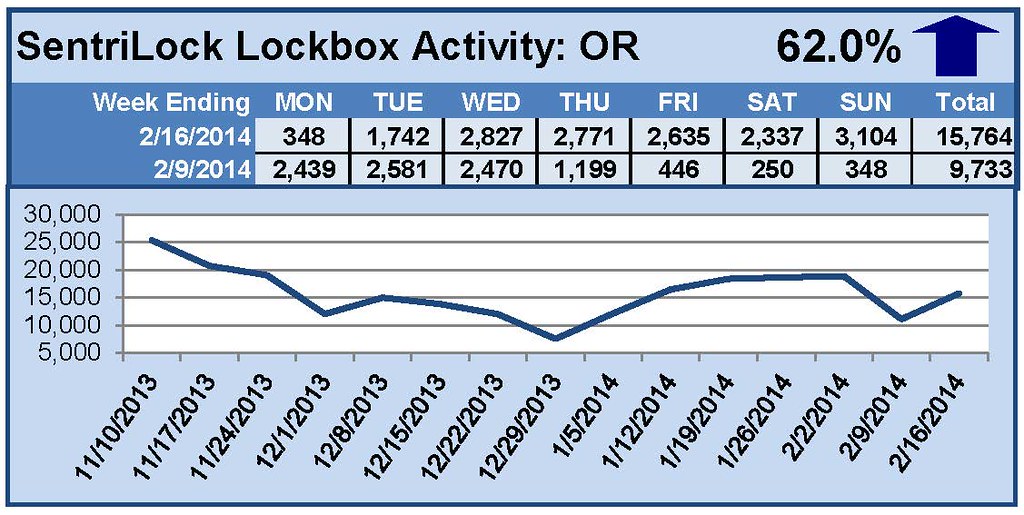
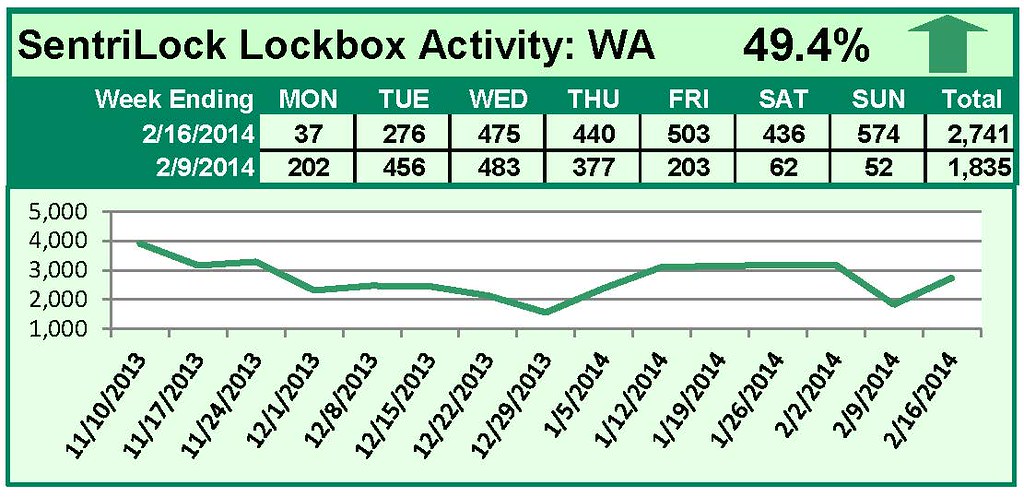
For the week of February 10-16, 2014, these charts show the number of times RMLS™ subscribers opened SentriLock lockboxes in Oregon and Washington. Activity largely rebounded in Oregon and Washington this week from the previous week’s winter storm.
For a larger version of each chart, visit the RMLS™ photostream on Flickr.
Please note: due to the RMLS™ transition to SentriLock, historical data is only currently available through the RMLS™ Flickr page, under the tag “Supra lockbox activity.” SentriLock data will continue accumulating until each chart represents a year of data.
by RMLS Communication Department | Feb 17, 2014

This Week’s Lockbox Activity
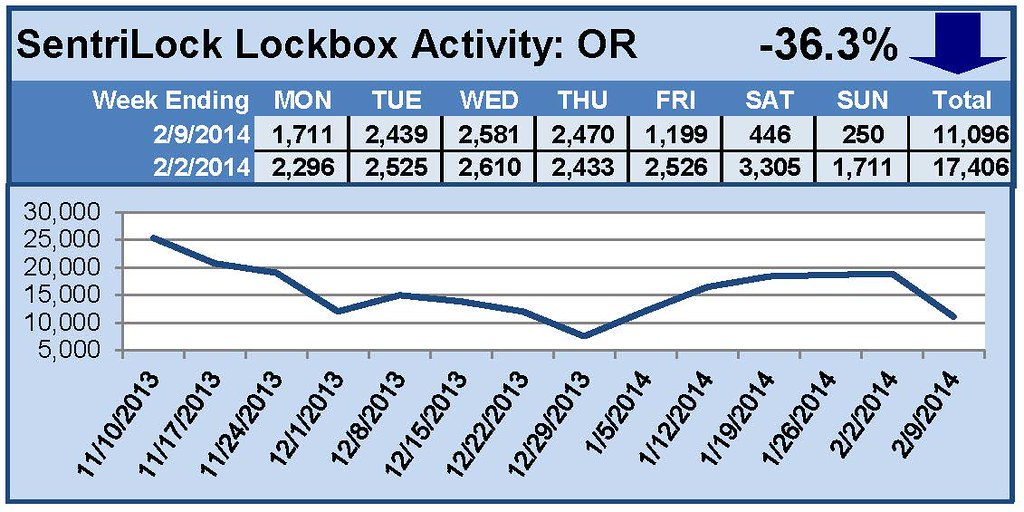
For the week of February 3-9, 2014, these charts show the number of times RMLS™ subscribers opened SentriLock lockboxes in Oregon and Washington. Activity fell sharply in both Oregon and Washington this week, likely due to the winter storm that descended upon the region over the weekend.
For a larger version of each chart, visit the RMLS™ photostream on Flickr.
Please note: due to the RMLS™ transition to SentriLock, historical data is only currently available through the RMLS™ Flickr page, under the tag “Supra lockbox activity.” SentriLock data will continue accumulating until each chart represents a year of data.
by RMLS Communication Department | Feb 10, 2014
This Week’s Lockbox Activity
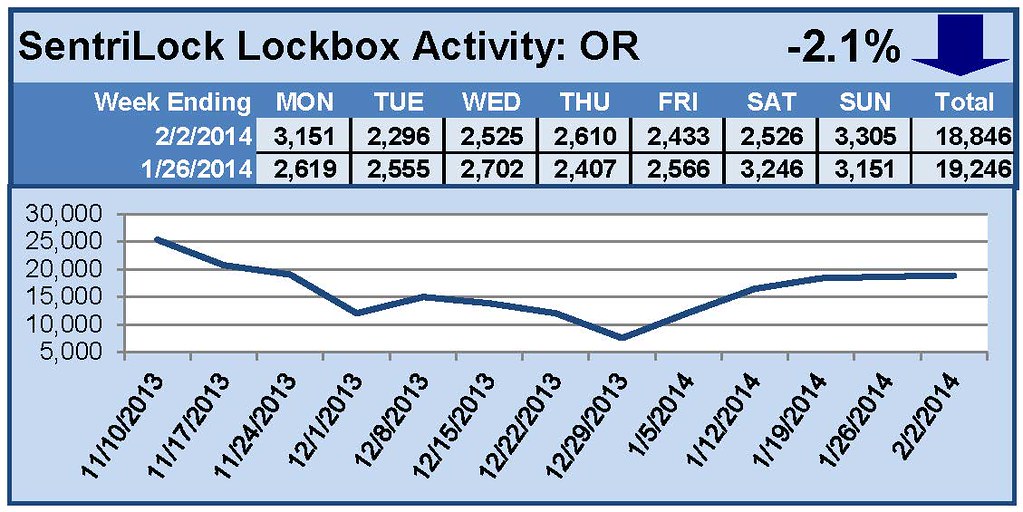
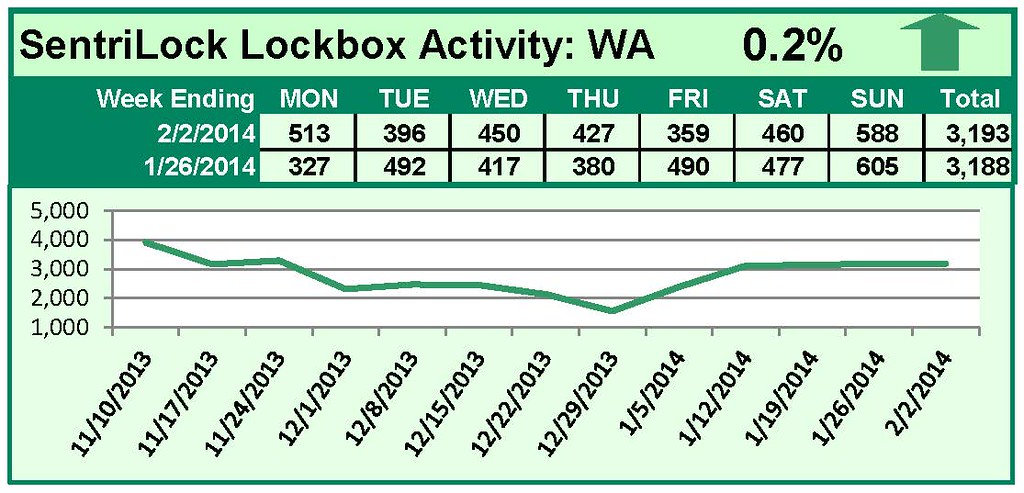
For the week of January 27-February 2, 2014, these charts show the number of times RMLS™ subscribers opened SentriLock lockboxes in Oregon and Washington. Activity increased slightly in Washington and fell in Oregon this week.
For a larger version of each chart, visit the RMLS™ photostream on Flickr.
Please note: due to the RMLS™ transition to SentriLock, historical data is only currently available through the RMLS™ Flickr page, under the tag “Supra lockbox activity.” SentriLock data will continue accumulating until each chart represents a year of data.
by RMLS Communication Department | Feb 3, 2014
This Week’s Lockbox Activity
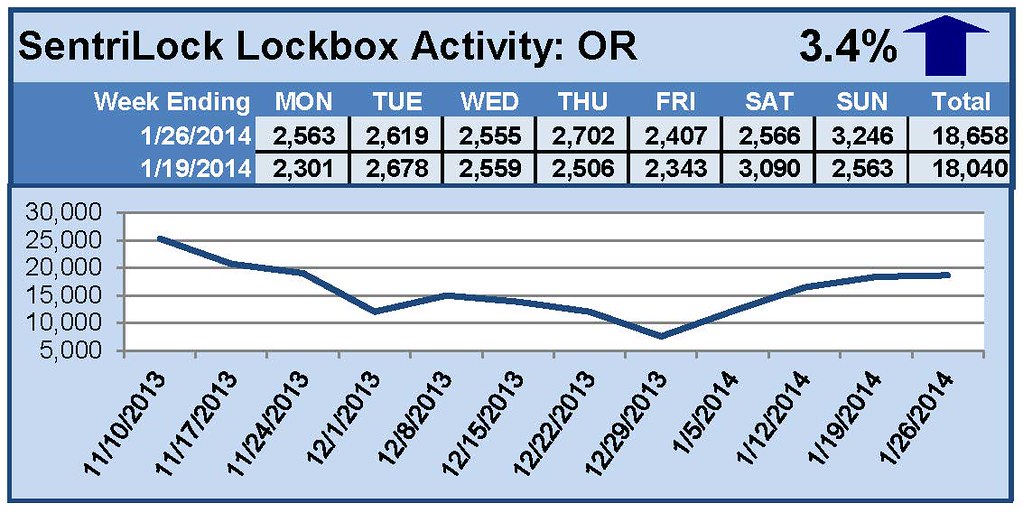
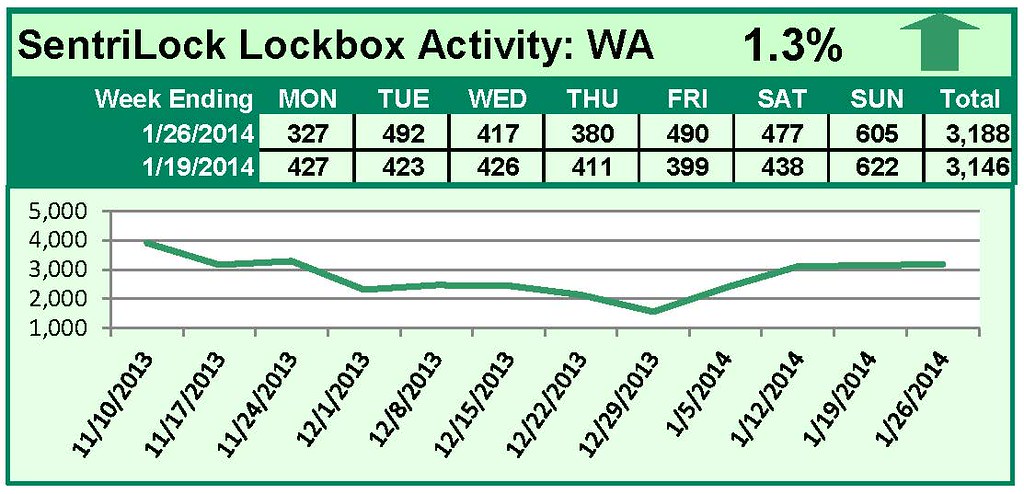
For the week of January 20-26, 2014, these charts show the number of times RMLS™ subscribers opened SentriLock lockboxes in Oregon and Washington. Both states saw increased activity this week.
For a larger version of each chart, visit the RMLS™ photostream on Flickr.
Please note: due to the RMLS™ transition to SentriLock, historical data is only currently available through the RMLS™ Flickr page, under the tag “Supra lockbox activity.” SentriLock data will continue accumulating until each chart represents a year of data.
by RMLS Communication Department | Jan 27, 2014

This Week’s Lockbox Activity
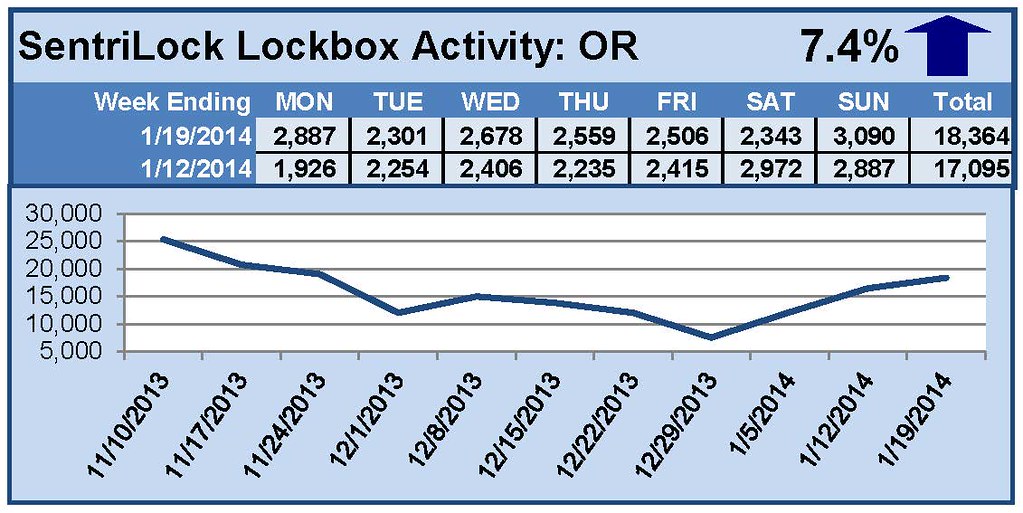
For the week of January 13-19, 2014, these charts show the number of times RMLS™ subscribers opened SentriLock lockboxes in Oregon and Washington. Showings rose in both states this week.
For a larger version of each chart, visit the RMLS™ photostream on Flickr.
Please note: due to the RMLS™ transition to SentriLock, historical data is only currently available through the RMLS™ Flickr page, under the tag “Supra lockbox activity.” SentriLock data will continue accumulating until each chart represents a year of data.
by RMLS Communication Department | Jan 20, 2014
This Week’s Lockbox Activity
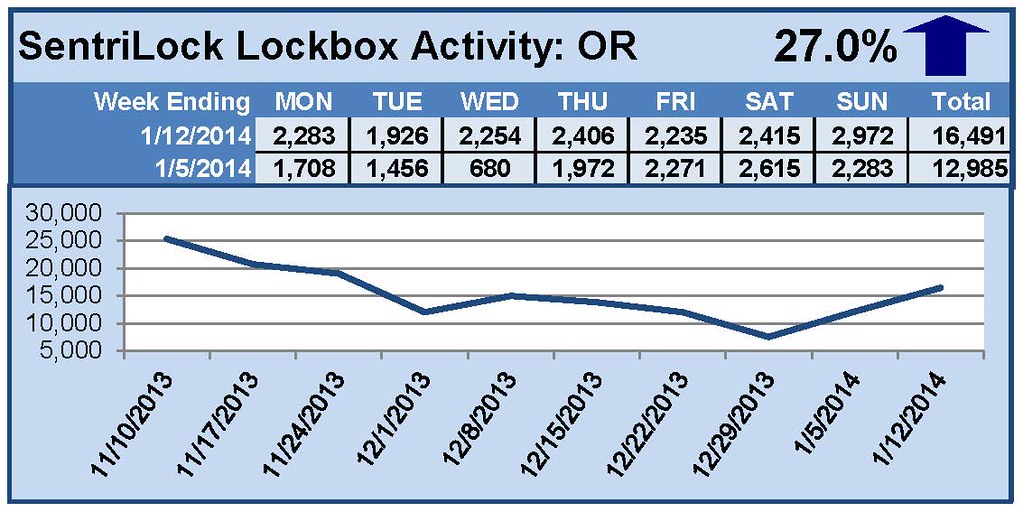
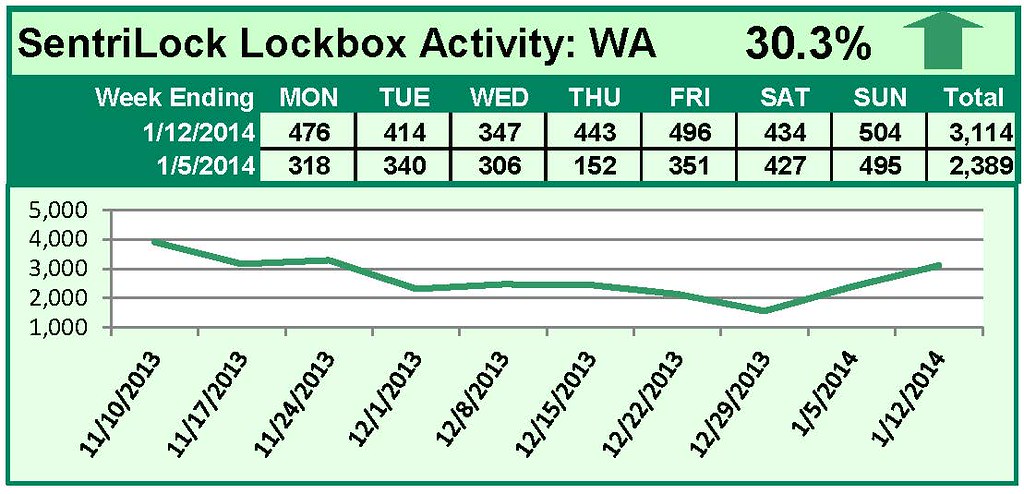
For the week of January 6-12, 2014, these charts show the number of times RMLS™ subscribers opened SentriLock lockboxes in Oregon and Washington. Showings rose significantly in both states this week.
For a larger version of each chart, visit the RMLS™ photostream on Flickr.
Please note: due to the RMLS™ transition to SentriLock, historical data is only currently available through the RMLS™ Flickr page, under the tag “Supra lockbox activity.” SentriLock data will continue accumulating until each chart represents a year of data.