![2016 Distressed Residential Properties]()
by RMLS Communication Department | Feb 3, 2017
The chart below shows the number of bank owned/REO and short sales in all areas of the RMLS™ system during 2016.

All areas when comparing percentage share of the market 2015 to 2016:
• Comparing 2015 to 2016, distressed sales as a percentage of closed sales decreased from 8.8% to 6.5%.
• New listings increased from 73,624 to 74,253, which is a very slight increase.
• Short sales comprised 1.0% of new listings and 1.2% of sold listings in 2016, each down 1.0% from 2015 respectively as a percentage of the market.
• Bank owned/REO properties comprised 4.0% of new listings and 5.3% of sales in 2016, decreasing 1.6% and 1.3%, respectively, from 2015.
Portland metro when comparing percentage share of the market 2015 to 2016:
• Comparing 2015 to 2016, distressed sales as a percentage of closed sales decreased from 7.4% to 7.3%.
• New listings rose from 40,427 to 40,662, which is a slight increase.
• Short sales comprised 0.9% of new listings and 1.5% of sold listings in 2016, down 1.0% and 0.6% from 2015 respectively as a percentage of the market.
• Bank owned/REO properties comprised 3.0% of new listings and 4.7% of sales in 2016, decreasing 1.8% and 0.6%, respectively, from 2015.
Clark County when comparing percentage share of the market 2015 to 2016:
• Comparing 2015 to 2016, distressed sales as a percentage of closed sales decreased from 8.3% to 4.2%.
• New listings rose from 10,506 to 10,825, which is a slight increase.
• Short sales comprised 1.5% of new listings and 1.6% of sold listings in 2016, down 1.4% and 1.4% from 2015 as a percentage of the market.
• Bank owned/REO properties comprised 2.3% of new listings and 2.6% of sales in 2016, decreasing 1.2% and 2.7% respectively from 2015.
Below are links to additional charts for some of our larger areas:
Portland Metro Area
Clark County, WA
Lane County, OR
Douglas County, OR
Coos County, OR
RMLS™ is pausing its quarterly publication of distressed properties information with the closing of 2016. If distressed properties become a larger portion of residential home sales in the future, distribution of this data may begin again.
If you want information on percentages of distressed sales in other areas not represented by our charts, please contact us at communications@rmls.com.
![2016 Distressed Residential Properties]()
by RMLS Communication Department | Jan 27, 2016
The chart below shows the number of bank owned/REO and short sales in all areas of the RMLS™ system during 2015.

All areas when comparing percentage share of the market 2014 to 2015:
• Comparing 2014 to 2015, distressed sales as a percentage of closed sales decreased from 10.4% to 8.8%.
• New listings increased from 68,291 to 73,624, which is a 7.8% increase.
• Short sales comprised 2.0% of new listings and 2.2% of sold listings in 2015, down 1.3% and 1.9% from 2014 respectively as a percentage of the market.
• Bank owned/REO properties comprised 5.6% of new listings and 6.6% of sales in 2015, increasing from 5.2% and 6.3%, respectively, in 2014.
Portland metro when comparing percentage share of the market 2014 to 2015:
• Comparing 2014 to 2015, distressed sales as a percentage of closed sales decreased from 8.6% to 7.4%.
• New listings rose from 37,283 to 40,427, which is a 8.4% increase.
• Short sales comprised 1.9% of new listings and 2.1% of sold listings in 2015, down 1.4% and 1.8% from 2014 respectively as a percentage of the market.
• Bank owned/REO properties comprised 4.8% of new listings and 5.3% of sales in 2015, increasing from 4.2% and 4.7%, respectively, in 2014.
Clark County when comparing percentage share of the market 2014 to 2015:
• Comparing 2014 to 2015, distressed sales as a percentage of closed sales decreased from 14.6% to 8.3%.
• New listings rose from 9,607 to 10,506, which is a 9.4% increase.
• Short sales comprised 2.9% of new listings and 3.0% of sold listings in 2015, down 1.8% and 3.2% from 2014 as a percentage of the market.
• Bank owned/REO properties comprised 3.5% of new listings and 5.3% of sales in 2015, decreasing from 5.8% and 8.4% respectively in 2014.
Below are links to additional charts for some of our larger areas:
Portland Metro Area
Clark County, WA
Lane County, OR
Douglas County, OR
Coos County, OR
If you want information on percentages of distressed sales in other areas not represented by our charts, please contact us at communications@rmls.com.
![2016 Distressed Residential Properties]()
by RMLS Communication Department | Jan 22, 2015
The chart below shows the number of bank owned/REO and short sales in all areas of the RMLS™ system during 2014.
 All areas when comparing percentage share of the market 2013 to 2014:
• Comparing 2013 to 2014, distressed sales as a percentage of closed sales decreased from 15.1% to 10.4%.
• New listings increased from 65,206 to 68,291, which is a 4.7% increase.
• Short sales comprised 3.3% of new listings and 4.1% of sold listings in 2014, down 3.1% and 4.0% from 2013 respectively as a percentage of the market.
• Bank owned/REO properties comprised 5.2% of new listings and 6.3% of sales in 2014, increasing from 4.5% and decreasing from 7.0%, respectively, in 2013.
Portland metro when comparing percentage share of the market 2013 to 2014:
• Comparing 2013 to 2014, distressed sales as a percentage of closed sales decreased from 13.2% to 8.6%.
• New listings rose from 35,524 to 37,283, which is a 4.9% increase.
• Short sales comprised 3.3% of new listings and 3.9% of sold listings in 2014, down 3.1% and 4.1% from 2013 respectively as a percentage of the market.
• Bank owned/REO properties comprised 4.2% of new listings and 4.7% of sales in 2014, increasing from 3.3% and decreasing from 5.2%, respectively, in 2013.
Clark County when comparing percentage share of the market 2013 to 2014:
• Comparing 2013 to 2014, distressed sales as a percentage of closed sales decreased from 22.4% to 14.6%.
• New listings rose from 9,079 to 9,607, which is a 5.8% increase.
• Short sales comprised 4.7% of new listings and 6.2% of sold listings in 2014, down 5.3% and 6.5% from 2013 as a percentage of the market.
• Bank owned/REO properties comprised 5.8% of new listings and 8.4% of sales in 2014, decreasing from 7.8% and 9.7% respectively in 2013.
Below are links to additional charts for some of our larger areas:
Portland Metro Area
Clark County, WA
Lane County, OR
Douglas County, OR
Coos County, OR
If you want information on percentages of distressed sales in other areas not represented by our charts, please contact us at communications@rmls.com.
![2016 Distressed Residential Properties]()
by RMLS Communication Department | Feb 5, 2014
The chart below shows the number of bank owned/REO and short sales in all areas of the RMLS™ system during 2013.
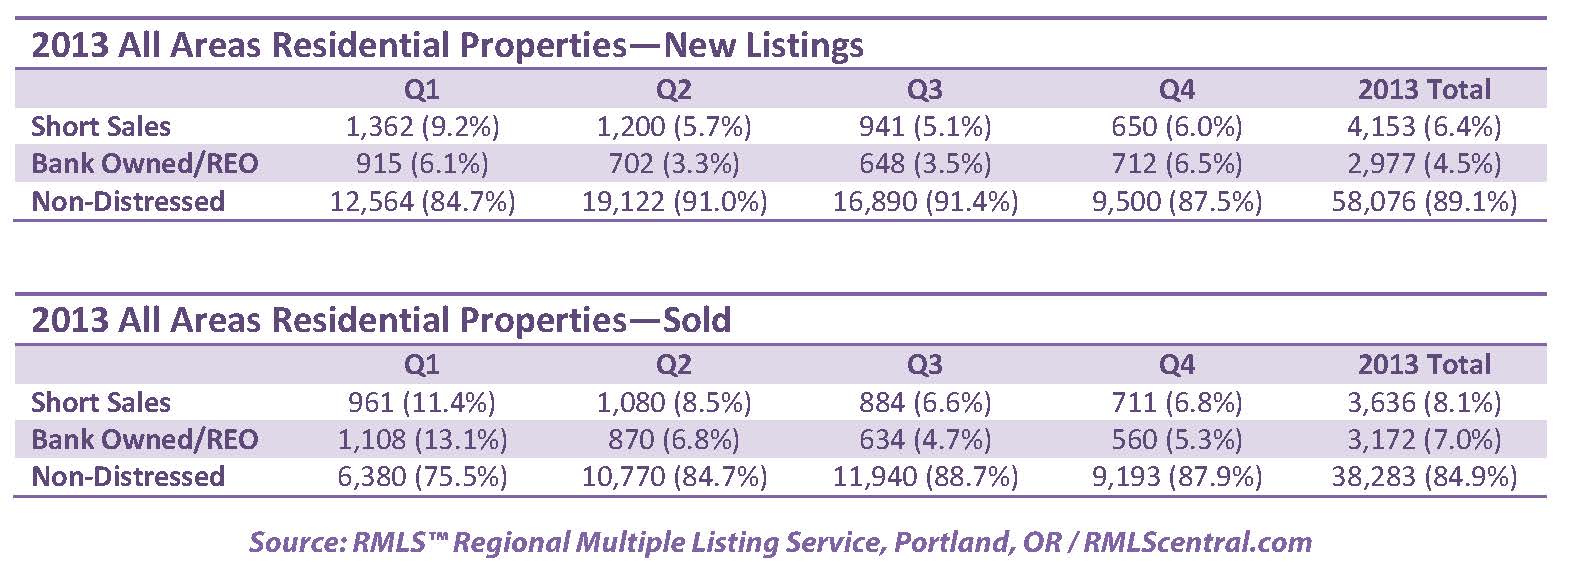
All areas when comparing percentage share of the market 2012 to 2013:
• Comparing 2012 to 2013, distressed sales as a percentage of closed sales decreased from 28.6% to 15.1%.
• New listings rose from 58,280 to 65,206 which is a 11.8% increase.
• Short sales comprised 6.4% of new listings and 8.1% of sold listings in 2013, down 4.9% and 4.0% from 2012 respectively as a percentage of the market.
• Bank owned/REO properties comprised 4.5% of new listings and 7.0% of sales in 2013, decreasing slightly from 10.3% and 16.5% respectively in 2012.
Portland metro when comparing percentage share of the market 2012 to 2013:
• Comparing 2012 to 2013, distressed sales as a percentage of closed sales decreased from 28.2% to 13.2%.
• New listings rose from 32,011 to 35,524 which is a 11.0% increase.
• Short sales comprised 6.4% of new listings and 8.0% of sold listings in 2013, down 5.7% and 4.3% from 2012 respectively as a percentage of the market.
• Bank owned/REO properties comprised 3.3% of new listings and 5.2% of sales in 2013, decreasing from 10.4% and 15.9% respectively in 2012.
Clark County when comparing percentage share of the market 2012 to 2013:
• Comparing 2012 to 2013, distressed sales as a percentage of closed sales decreased from 32.2% to 22.4%.
• New listings rose from 7,280 to 9,079 which is a 24.7% increase.
• Short sales comprised 10.0% of new listings and 12.7% of sold listings in 2013, down 9.1% and 5.8% from 2012 respectively as a percentage of the market.
• Bank owned/REO properties comprised 7.8% of new listings and 9.7% of sales in 2013, decreasing from 8.8% and 13.7% respectively in 2012.
Below are links to additional charts for some of our larger areas:
Portland Metro
Clark County, WA
Lane County, OR
Douglas County, OR
Coos County, OR
If you want information on percentages of distressed sales in other areas not represented by our charts, please contact us at communications@rmls.com.
![2016 Distressed Residential Properties]()
by RMLS Communication Department | Aug 1, 2013
 Complications have continued for agents with vacant listings, as we’ve heard reported by some subscribers since the last entry in the RMLS™ safety series. Copper, appliances, and staging furniture have gone missing. Squatters have remained a very real problem. It is imperative that REALTORS® take measures to reduce a listing’s susceptibility to damage and vandalism.
The NAR Risk Management Committee recently released a video tutorial detailing tools that agents can utilize to better protect their clients and their listings such as Google Alerts and IfThisThenThat.
The following ideas, while perhaps seemingly obvious, might still be useful. The number of vacant, foreclosed, and other distressed properties are declining as the market begins to rebound, but there is still a ways to go.
- Visit the property weekly, making times of your visits sporadic. Do not set a pattern.
- Hire housesitters to either stay at the house or visit regularly if you are not able to.
- Check all locks and entrances to the house, including windows. This is especially important following an open house or showing. I have received several reports of houses being cleaned out after a window was left ajar, or just unlocked.
- Park a car in the driveway. This blocks access to the garage (prime spot for clearing out large items without looking suspicious) as well as gives the impression that someone is at the house regularly.
- Bring up safety topics and concerns during office staff meetings. Your colleagues might have greater insight or similar experiences to share. Real estate is a word-of-mouth business and keeping the conversation out in the open is a very powerful tool.
- Be aware that copper piping is very susceptible to theft. It is known to happen in existing homes, but new construction sites face the greatest threat.
- Set lights in the house on a timer.
- Don’t mention the location of the lockbox in the listing’s public remarks. To gain entry to the house, squatters can just as soon pick a lock, but the lockbox has been known to be a target. There have been reports over the years of listings with missing lockboxes, but no damage or theft to the house. Many times vandals take bolt cutters to the shackle and take the box to work on it elsewhere to limit visibility. If that’s the case, call the police, change the locks, and consider calling your business insurance agent.
- Don’t hesitate to enlist the help of neighbors to keep an eye on the place. It is also in their best interest that the house remains safe!
Additional Resources:
Real Estate: Loss Prevention for Vacant Buildings
Protecting Vacant Real Estate Property
Copper Theft: How to Protect Your Property from Vandalism
Theft and Vandalism Claims Have Carriers on Edge in Vacant Property Segment
To report an incident or concerns to RMLS™, please contact Kelly McKenna at kelly.m@rmls.com.
