![Residential Distressed Properties for Fourth Quarter (October-December) 2013]()
by RMLS Communication Department | Jan 22, 2014
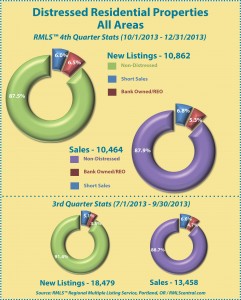 This chart shows the number of bank owned/REO properties and short sales in all areas of the RMLS™ system during the fourth quarter of 2013.
Below are links to additional charts for some of our larger areas.
• Portland Metro Distressed Properties (4th Quarter 2013)
• Clark County, WA Distressed Properties (4th Quarter 2013)
• Lane County, OR Distressed Properties (4th Quarter 2013)
• Douglas County, OR Distressed Properties (4th Quarter 2013)
• Coos County, OR Distressed Properties (4th Quarter 2013)
Here are some additional facts about distressed residential properties in the fourth quarter of 2013:
All areas when comparing percentage share of the market, fourth quarter 2013 to third quarter 2013:
• When comparing the fourth quarter 2013 to third quarter 2013, distressed sales as a percentage of new listings increased by 3.9% (12.5 v. 8.6%).
• In a comparison of the fourth quarter 2013 to third quarter 2013, distressed sales as a percentage of closed sales increased by 0.8% (12.1 v. 11.3%).
• Short sales comprised 6.0% of new listings and 6.8% of sales in the fourth quarter of 2013, up 0.9% and 0.2% from the third quarter of 2013, respectively.
• Bank owned/REO properties comprised 6.5% of new listings and 5.3% of sales in the fourth quarter of 2013, up 3.0% and 0.6% from the third quarter of 2013, respectively.
Portland Metro when comparing percentage share of the market, fourth quarter 2013 to third quarter 2013:
• When comparing the fourth quarter 2013 to third quarter 2013, distressed sales as a percentage of new listings increased by 3.1% (10.6% v. 7.5%).
• In a comparison of fourth quarter 2013 to third quarter 2013, distressed sales as a percentage of closed sales increased by 1.4% (10.8% v. 9.4%).
• Short sales comprised 6.0% of new listings and 7.2% of sales in the fourth quarter of 2013, up 0.7% and 0.9% from the third quarter of 2013, respectively.
• Bank owned/REO properties comprised 4.6% of new listings and 3.6% of sales in the fourth quarter of 2013, up 2.4% and 0.5% from the third quarter of 2013, respectively.
Clark County when comparing percentage share of the market, fourth quarter 2013 to third quarter 2013:
• When comparing the fourth quarter 2013 to third quarter 2013, distressed sales as a percentage of new listings increased by 4.7% (18.6% v. 13.9%).
• In a comparison of fourth quarter 2013 to third quarter 2013, distressed sales as a percentage of closed sales decreased by 1.9% (17.6% v. 19.5%).
• Short sales comprised 8.2% of new listings and 9.1% of sales in the fourth quarter of 2013, up 0.6% for new listings and down 2.0% for sales when compared to the third quarter of 2013, respectively.
• Bank owned/REO properties comprised 10.4% of new listings and 8.5% of sales in the fourth quarter of 2013, up 4.1% and up 0.1% from the third quarter of 2013, respectively.
If you’d like more information or percentages of distressed residential sales in other areas not represented by our charts, please contact us at communications@rmls.com.
![Residential Distressed Properties for Fourth Quarter (October-December) 2013]()
by RMLS Communication Department | Oct 15, 2013

This chart shows the number of bank owned/REO properties and short sales in all areas of the RMLS™ system during the third quarter of 2013.
Below are links to additional charts for some of our larger areas.
• Portland Metro Distressed Properties (3rd Quarter 2013)
• Clark County, WA Distressed Properties (3rd Quarter 2013)
• Lane County, OR Distressed Properties (3rd Quarter 2013)
• Douglas County, OR Distressed Properties (3rd Quarter 2013)
• Coos County, OR Distressed Properties (3rd Quarter 2013)
Here are some additional facts about distressed residential properties in the third quarter of 2013:
All areas when comparing percentage share of the market, third quarter 2013 to second quarter 2013:
• When comparing the third quarter 2013 to second quarter 2013, distressed sales as a percentage of new listings decreased by .4% (8.6% v. 9.0%).
• In a comparison of the third quarter 2013 to second quarter 2013, distressed sales as a percentage of closed sales decreased by 4.0% (11.3% v. 15.3%).
• Short sales comprised 5.1% of new listings and 6.6% of sales in the third quarter of 2013, down .6% and 1.9% from the second quarter of 2013, respectively.
• Bank owned/REO properties comprised 3.5% of new listings and 4.7% of sales in the third quarter of 2013, up .2% and down 2.1% from the second quarter of 2013, respectively.
Portland Metro when comparing percentage share of the market, third quarter 2013 to second quarter 2013:
• When comparing the third quarter 2013 to second quarter 2013, distressed sales as a percentage of new listings decreased by .6% (7.5% v. 8.1%).
• In a comparison of third quarter 2013 to second quarter 2013, distressed sales as a percentage of closed sales decreased by 4.0% (9.4% v. 13.4%).
• Short sales comprised 5.3% of new listings and 6.3% of sales in the third quarter of 2013, down .5% and 2.1% from the second quarter of 2013, respectively.
• Bank owned/REO properties comprised 2.2% of new listings and 3.1% of sales in the third quarter of 2013, down .1% and 1.9% from the second quarter of 2013, respectively.
Clark County when comparing percentage share of the market, third quarter 2013 to second quarter 2013:
• When comparing the third quarter 2013 to second quarter 2013, distressed sales as a percentage of new listings decreased by 2.7% (13.9% v. 16.6%).
• In a comparison of third quarter 2013 to second quarter 2013, distressed sales as a percentage of closed sales decreased by 4.8% (19.5% v. 24.3%).
• Short sales comprised 7.6% of new listings and 11.1% of sales in the third quarter of 2013, down 2.1% for new listings and 2.5% for sales when compared to the second quarter of 2013, respectively.
• Bank owned/REO properties comprised 6.3% of new listings and 8.4% of sales in the third quarter of 2013, down .6% and 2.3% from the second quarter of 2013, respectively.
If you’d like more information or percentages of distressed residential sales in other areas not represented by our charts, please contact us at communications@rmls.com.
![Residential Distressed Properties for Fourth Quarter (October-December) 2013]()
by RMLS Communication Department | Jul 18, 2013

This chart shows the number of bank owned/REO properties and short sales in all areas of the RMLS™ system during the second quarter of 2013.
Below are links to additional charts for some of our larger areas.
• Portland Metro Distressed Properties (2nd Quarter 2013)
• Clark County, WA Distressed Properties (2nd Quarter 2013)
• Lane County, OR Distressed Properties (2nd Quarter 2013)
• Douglas County, OR Distressed Properties (2nd Quarter 2013)
• Coos County, OR Distressed Properties (2nd Quarter 2013)
Here are some additional facts about distressed residential properties in the second quarter of 2013:
All areas when comparing percentage share of the market, second quarter 2013 to first quarter 2013:
• When comparing the second quarter 2013 to first quarter 2013, distressed sales as a percentage of new listings decreased by 6.3% (9.0% v. 15.3%).
• In a comparison of the second quarter 2013 to first quarter 2013, distressed sales as a percentage of closed sales decreased by 9.2% (15.3% v. 24.5%).
• Short sales comprised 5.7% of new listings and 8.5% of sales in the second quarter of 2013, down 3.5% and down 2.9% from the first quarter of 2013, respectively.
• Bank owned/REO properties comprised 3.3% of new listings and 6.8% of sales in the second quarter of 2013, down 2.8% and 6.3% from the first quarter of 2013, respectively.
Portland Metro when comparing percentage share of the market, second quarter 2013 to first quarter 2013:
• When comparing the second quarter 2013 to first quarter 2013, distressed sales as a percentage of new listings decreased by 5.8% (8.1% v. 13.9%).
• In a comparison of second quarter 2013 to first quarter 2013, distressed sales as a percentage of closed sales decreased by 8.8% (13.4% v. 22.2%).
• Short sales comprised 5.8% of new listings and 8.4% of sales in the second quarter of 2013, down 2.9% and 2.8% from the first quarter of 2013, respectively.
• Bank owned/REO properties comprised 2.3% of new listings and 5.0% of sales in the second quarter of 2013, down 2.9% and 6.0% from the first quarter of 2013, respectively.
Clark County when comparing percentage share of the market, second quarter 2013 to first quarter 2013:
• When comparing the second quarter 2013 to first quarter 2013, distressed sales as a percentage of new listings decreased by 7.1% (16.6% v. 23.7%).
• In a comparison of second quarter 2013 to first quarter 2013, distressed sales as a percentage of closed sales decreased by 6.3% (24.3% v. 30.6%).
• Short sales comprised 9.7% of new listings and 13.6% of sales in the second quarter of 2013, down 5.0% for new listings and 5.1% for sales when compared to the first quarter of 2013, respectively.
• Bank owned/REO properties comprised 6.9% of new listings and 10.7% of sales in the second quarter of 2013, down 2.1% and 1.2% from the first quarter of 2013, respectively.
If you’d like more information or percentages of distressed residential sales in other areas not represented by our charts, please contact us at communications@rmls.com.
![Residential Distressed Properties for Fourth Quarter (October-December) 2013]()
by RMLS Communication Department | May 8, 2013
 This post was written by Lizbeth Hale—a REALTOR® working in Clackamas, OR who recently helped found the Oregon chapter of the National Association of Hispanic Real Estate Professionals. She wrote in to share more about the organization with RMLS™ subscribers. NAHREP Oregon will be holding two events this month: a NAHREP mixer on May 8th in Clackamas, and “Winning the Multiple Offer Bidding War,” a class on May 22nd in North Portland.
The National Association of Hispanic Real Estate Professionals (NAHREP) is a trade association with 20,000 members and 45 chapters across the country who are dedicated to advancing sustainable Hispanic ownership. Hispanics are the fastest-growing demographic in the United States, with purchasing power of over $1 trillion and a projected $1.5 trillion by 2015. The Hispanic demographic, currently 52 million, is the second largest consumer group in the US and has increased 42 percent since the 2002 Census. While the overall US population is aging sharply, the median age of the Latino population is 28 years old, squarely within the average new homebuyer age of 26-45 years old. These demographic and consumer trends make it an economic imperative within the housing industry to execute strategies to best serve this burgeoning segment of the US population.
 NAHREP accomplishes its mission by:
- educating and empowering the real estate professionals who serve Hispanic home buyers and sellers
- advocating for public policy that supports the trade association’s mission
- facilitating relationships among industry stakeholders, real estate practitioners, and other housing industry professionals.
Networking Opportunities
NAHREP conferences, seminars, and our chapter meetings provide a unique forum for the excited exchange between members of ideas, experiences, and shared challenges. These gatherings offer a rich cultural/business connection that our members consider invaluable.
 Advocacy
NAHREP is the largest minority trade group in the real estate industry. We have a powerful and influential voice on legislative issues related to lending parameters, business practices, and regulations that affect access to homeownership.
We at NAHREP believe homes should be sold organically and individually whenever possible. This will allow Hispanics and other minority groups to achieve their homeownership goals, while simultaneously stimulating the economy. Property disposition strategies that favor investors and Wall Street firms such as auctions, bulk sales, and “drop-bid” trustee sales should be discontinued in markets where there is strong demand for residential properties.
NAHREP believes public policies can help provide Hispanic and other minority groups with an equal opportunity to become proud American homeowners, as well as provide desperately needed economic activity in the housing market.
As the President of NAHREP Oregon, I believe that it is every professional’s responsibility to get involved with NAHREP. To better understand the diversity growth in Oregon and better serve an underserved community. Hispanics prefer to do business with a professional that understands their culture, even if they don’t speak the same language.
Hispanics will make 40 percent of homebuyers in the next 20 years. The Hispanic population in Oregon is the 18th largest in the nation—467,922, or 12% of the state’s total population. Oregon Hispanics had a purchasing power of $7 billion. In 2009, Oregon was among the ten states with the highest Latino business growth rate in the nation (43.6 percent), with a rate nearly double the national rate of growth. In Oregon, 40% of Hispanics are homeowners.
![Residential Distressed Properties for Fourth Quarter (October-December) 2013]()
by RMLS Communication Department | Apr 19, 2013
 This chart shows the number of bank owned/REO properties and short sales in all areas of the RMLS™ system during the first quarter of 2013.
Below are links to additional charts for some of our larger areas.
• Portland Metro Distressed Properties (1st Quarter 2013)
• Clark County, WA Distressed Properties (1st Quarter 2013)
• Lane County, OR Distressed Properties (1st Quarter 2013)
• Douglas County, OR Distressed Properties (1st Quarter 2013)
• Coos County, OR Distressed Properties (1st Quarter 2013)
Here are some additional facts about distressed residential properties in the first quarter of 2013:
All areas when comparing percentage share of the market, first quarter 2013 to fourth quarter 2012:
• When comparing the first quarter 2013 to fourth quarter 2012, distressed sales as a percentage of new listings decreased by 6.1% (15.3% v. 21.4%).
• In a comparison of the first quarter 2013 to fourth quarter 2012, distressed sales as a percentage of closed sales increased by 0.9% (24.5% v. 23.6%).
• Short sales comprised 9.2% of new listings and 11.4% of sales in the first quarter of 2013, down 2.1% and down 0.5% from the fourth quarter of 2012, respectively.
• Bank owned/REO properties comprised 6.1% of new listings and 13.1% of sales in the first quarter of 2013, down 4.0% and up 1.4% from the fourth quarter of 2012, respectively.
Portland Metro when comparing percentage share of the market, first quarter 2013 to fourth quarter 2012:
• When comparing the first quarter 2013 to fourth quarter 2012, distressed sales as a percentage of new listings decreased by 7.2% (13.9% v. 21.1%).
• In a comparison of first quarter 2013 to fourth quarter 2012, distressed sales as a percentage of closed sales decreased by 0.6% (22.2% v. 22.8%).
• Short sales comprised 8.7% of new listings and 11.2% of sales in the first quarter of 2013, down 3.3% and 1.1% from the fourth quarter of 2012, respectively.
• Bank owned/REO properties comprised 5.2% of new listings and 11.0% of sales in the first quarter of 2013, down 3.9% and up 0.5% from the fourth quarter of 2012, respectively.
Clark County when comparing percentage share of the market, first quarter 2013 to fourth quarter 2012:
• When comparing the first quarter 2013 to fourth quarter 2012, distressed sales as a percentage of new listings decreased by 3.0% (23.7% v. 26.7%).
• In a comparison of first quarter 2013 to fourth quarter 2012, distressed sales as a percentage of closed sales increased by 1.8% (30.6% v. 28.8%).
• Short sales comprised 14.7% of new listings and 18.7% of sales in the first quarter of 2013, down 3.1% for new listings and up 0.1% for sales when compared to the fourth quarter of 2012, respectively.
• Bank owned/REO properties comprised 9.0% of new listings and 11.9% of sales in the first quarter of 2013, up 0.1% and 1.7% from the fourth quarter of 2012, respectively.
If you’d like more information or percentages of distressed residential sales in other areas not represented by our charts, please contact us at communications@rmls.com.
![Residential Distressed Properties for Fourth Quarter (October-December) 2013]()
by RMLS Communication Department | Jan 18, 2013

This chart shows the number of bank owned properties and short sales in all areas of the RMLS™ system during the fourth quarter of 2012.
Below are links to additional charts for some of our larger areas.
• Portland Metro Distressed Properties (4th Quarter 2012)
• Clark County, WA Distressed Properties (4th Quarter 2012)
• Lane County, OR Distressed Properties (4th Quarter 2012)
• Douglas County, OR Distressed Properties (4th Quarter 2012)
• Coos County, OR Distressed Properties (4th Quarter 2012)
Here are some additional facts about distressed residential properties in the fourth quarter of 2012:
All areas when comparing percentage share of the market, fourth quarter 2012 to third quarter 2012:
• When comparing the fourth quarter of 2012 to the third quarter, distressed sales as a percentage of new listings increased by 3.2% (21.4% v. 18.2%).
• In a comparison of the fourth quarter of 2012 to the third quarter, distressed sales as a percentage of closed sales decreased by 1.2% (23.6% v. 24.8%).
• Short sales comprised 11.3% of new listings and 11.9% of sales in the fourth quarter of 2012, up 1.5% and down .3% from the third quarter of 2012, respectively.
• Bank owned/REO properties comprised 10.1% of new listings and 11.7% of sales in the fourth quarter of 2012, up 1.7% and down .9% from the third quarter of 2012, respectively.
Portland Metro when comparing percentage share of the market, fourth quarter 2012 to third quarter 2012:
• When comparing the fourth quarter of 2012 to the third quarter, distressed sales as a percentage of new listings increased by 2.6% (21.1% v. 18.5%).
• In a comparison of fourth quarter 2012 to third quarter, distressed sales as a percentage of closed sales decreased by 1.4% (22.8% v. 24.2%).
• Short sales comprised 12.0% of new listings and 12.3% of sales in the fourth quarter of 2012, up 1.8% and down .2% from the third quarter of 2012, respectively.
• Bank owned/REO properties comprised 9.1% of new listings and 10.5% of sales in the fourth quarter of 2012, up .8% and down 1.2% from the third quarter of 2012, respectively.
Clark County when comparing percentage share of the market, fourth quarter 2012 to third quarter 2012:
• When comparing the fourth quarter of 2012 to the third quarter, distressed sales as a percentage of new listings increased by 2.1% (26.7% v. 24.6%).
• In a comparison of fourth quarter 2012 to third quarter 2012, distressed sales as a percentage of closed sales decreased by 1.0% (28.8% v. 29.8%).
• Short sales comprised 17.8% of new listings and 18.6% of sales in the fourth quarter of 2012, up .6% for new listings and down 1.5% for sales when compared to the third quarter of 2012, respectively.
• Bank owned/REO properties comprised 8.9% of new listings and 10.2% of sales in the fourth quarter of 2012, up 1.5% and .5% from the third quarter of 2012, respectively.
If you’d like more information or percentages of distressed residential sales in other areas not represented by our charts, please contact us at communications@rmls.com.


