![Residential Distressed Properties for First Quarter (January-March) 2014]()
by RMLS Communication Department | Apr 17, 2014
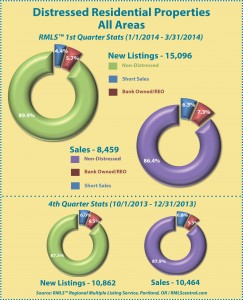
This chart shows the number of bank owned/REO properties and short sales in all areas of the RMLS™ system during the first quarter of 2014.
Below are links to additional charts for some of our larger areas.
• Portland Metro Distressed Properties (1st Quarter 2014)
• Clark County, WA Distressed Properties (1st Quarter 2014)
• Lane County, OR Distressed Properties (1st Quarter 2014)
• Douglas County, OR Distressed Properties (1st Quarter 2014)
• Coos County, OR Distressed Properties (1st Quarter 2014)
Here are some additional facts about distressed residential properties in the first quarter of 2014:
All areas when comparing percentage share of the market, first quarter 2014 to fourth quarter 2013:
• When comparing the first quarter 2014 to fourth quarter 2013, distressed sales as a percentage of new listings decreased by 2.4% (10.1 v. 12.5%).
• In a comparison of the first quarter 2014 to fourth quarter 2013, distressed sales as a percentage of closed sales increased by 1.5% (13.6 v. 12.1%).
• Short sales comprised 4.4% of new listings and 6.3% of sales in the first quarter of 2014, down 1.6% and 0.5% from the fourth quarter of 2013, respectively.
• Bank owned/REO properties comprised 5.7% of new listings and 7.3% of sales in the first quarter of 2014, down 0.8% and up 2.0% from the fourth quarter of 2013, respectively.
Portland metro when comparing percentage share of the market, first quarter 2014 to fourth quarter 2013:
• When comparing the first quarter 2014 to fourth quarter 2013, distressed sales as a percentage of new listings decreased by 1.7% (8.9 v. 10.6%).
• In a comparison of first quarter 2014 to fourth quarter 2013, distressed sales as a percentage of closed sales increased by 0.2% (11.0 v. 10.8%).
• Short sales comprised 4.3% of new listings and 6.1% of sales in the first quarter of 2014, down 1.7% and 1.1% from the fourth quarter of 2013, respectively.
• Bank owned/REO properties comprised 4.6% of new listings and 4.9% of sales in the first quarter of 2014, even with and up 1.3% from the fourth quarter of 2013, respectively.
Clark County when comparing percentage share of the market, first quarter 2014 to fourth quarter 2013:
• When comparing the first quarter 2014 to fourth quarter 2013, distressed sales as a percentage of new listings decreased by 6.1% (12.5 v. 18.6%).
• In a comparison of first quarter 2014 to fourth quarter 2013, distressed sales as a percentage of closed sales increased by 5.5% (23.1 vs. 17.6%).
• Short sales comprised 5.9% of new listings and 10.9% of sales in the first quarter of 2014, up 2.3% for new listings and 1.8% for sales when compared to the fourth quarter of 2013, respectively.
• Bank owned/REO properties comprised 6.6% of new listings and 12.2% of sales in the first quarter of 2014, down 3.8% and up 3.7% from the fourth quarter of 2013, respectively.
If you’d like more information or percentages of distressed residential sales in other areas not represented by our charts, please contact us at communications@rmls.com.
![Residential Distressed Properties for First Quarter (January-March) 2014]()
by RMLS Communication Department | Jan 22, 2014
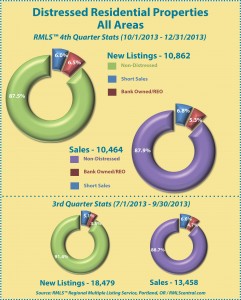 This chart shows the number of bank owned/REO properties and short sales in all areas of the RMLS™ system during the fourth quarter of 2013.
Below are links to additional charts for some of our larger areas.
• Portland Metro Distressed Properties (4th Quarter 2013)
• Clark County, WA Distressed Properties (4th Quarter 2013)
• Lane County, OR Distressed Properties (4th Quarter 2013)
• Douglas County, OR Distressed Properties (4th Quarter 2013)
• Coos County, OR Distressed Properties (4th Quarter 2013)
Here are some additional facts about distressed residential properties in the fourth quarter of 2013:
All areas when comparing percentage share of the market, fourth quarter 2013 to third quarter 2013:
• When comparing the fourth quarter 2013 to third quarter 2013, distressed sales as a percentage of new listings increased by 3.9% (12.5 v. 8.6%).
• In a comparison of the fourth quarter 2013 to third quarter 2013, distressed sales as a percentage of closed sales increased by 0.8% (12.1 v. 11.3%).
• Short sales comprised 6.0% of new listings and 6.8% of sales in the fourth quarter of 2013, up 0.9% and 0.2% from the third quarter of 2013, respectively.
• Bank owned/REO properties comprised 6.5% of new listings and 5.3% of sales in the fourth quarter of 2013, up 3.0% and 0.6% from the third quarter of 2013, respectively.
Portland Metro when comparing percentage share of the market, fourth quarter 2013 to third quarter 2013:
• When comparing the fourth quarter 2013 to third quarter 2013, distressed sales as a percentage of new listings increased by 3.1% (10.6% v. 7.5%).
• In a comparison of fourth quarter 2013 to third quarter 2013, distressed sales as a percentage of closed sales increased by 1.4% (10.8% v. 9.4%).
• Short sales comprised 6.0% of new listings and 7.2% of sales in the fourth quarter of 2013, up 0.7% and 0.9% from the third quarter of 2013, respectively.
• Bank owned/REO properties comprised 4.6% of new listings and 3.6% of sales in the fourth quarter of 2013, up 2.4% and 0.5% from the third quarter of 2013, respectively.
Clark County when comparing percentage share of the market, fourth quarter 2013 to third quarter 2013:
• When comparing the fourth quarter 2013 to third quarter 2013, distressed sales as a percentage of new listings increased by 4.7% (18.6% v. 13.9%).
• In a comparison of fourth quarter 2013 to third quarter 2013, distressed sales as a percentage of closed sales decreased by 1.9% (17.6% v. 19.5%).
• Short sales comprised 8.2% of new listings and 9.1% of sales in the fourth quarter of 2013, up 0.6% for new listings and down 2.0% for sales when compared to the third quarter of 2013, respectively.
• Bank owned/REO properties comprised 10.4% of new listings and 8.5% of sales in the fourth quarter of 2013, up 4.1% and up 0.1% from the third quarter of 2013, respectively.
If you’d like more information or percentages of distressed residential sales in other areas not represented by our charts, please contact us at communications@rmls.com.
![Residential Distressed Properties for First Quarter (January-March) 2014]()
by RMLS Communication Department | Oct 15, 2013

This chart shows the number of bank owned/REO properties and short sales in all areas of the RMLS™ system during the third quarter of 2013.
Below are links to additional charts for some of our larger areas.
• Portland Metro Distressed Properties (3rd Quarter 2013)
• Clark County, WA Distressed Properties (3rd Quarter 2013)
• Lane County, OR Distressed Properties (3rd Quarter 2013)
• Douglas County, OR Distressed Properties (3rd Quarter 2013)
• Coos County, OR Distressed Properties (3rd Quarter 2013)
Here are some additional facts about distressed residential properties in the third quarter of 2013:
All areas when comparing percentage share of the market, third quarter 2013 to second quarter 2013:
• When comparing the third quarter 2013 to second quarter 2013, distressed sales as a percentage of new listings decreased by .4% (8.6% v. 9.0%).
• In a comparison of the third quarter 2013 to second quarter 2013, distressed sales as a percentage of closed sales decreased by 4.0% (11.3% v. 15.3%).
• Short sales comprised 5.1% of new listings and 6.6% of sales in the third quarter of 2013, down .6% and 1.9% from the second quarter of 2013, respectively.
• Bank owned/REO properties comprised 3.5% of new listings and 4.7% of sales in the third quarter of 2013, up .2% and down 2.1% from the second quarter of 2013, respectively.
Portland Metro when comparing percentage share of the market, third quarter 2013 to second quarter 2013:
• When comparing the third quarter 2013 to second quarter 2013, distressed sales as a percentage of new listings decreased by .6% (7.5% v. 8.1%).
• In a comparison of third quarter 2013 to second quarter 2013, distressed sales as a percentage of closed sales decreased by 4.0% (9.4% v. 13.4%).
• Short sales comprised 5.3% of new listings and 6.3% of sales in the third quarter of 2013, down .5% and 2.1% from the second quarter of 2013, respectively.
• Bank owned/REO properties comprised 2.2% of new listings and 3.1% of sales in the third quarter of 2013, down .1% and 1.9% from the second quarter of 2013, respectively.
Clark County when comparing percentage share of the market, third quarter 2013 to second quarter 2013:
• When comparing the third quarter 2013 to second quarter 2013, distressed sales as a percentage of new listings decreased by 2.7% (13.9% v. 16.6%).
• In a comparison of third quarter 2013 to second quarter 2013, distressed sales as a percentage of closed sales decreased by 4.8% (19.5% v. 24.3%).
• Short sales comprised 7.6% of new listings and 11.1% of sales in the third quarter of 2013, down 2.1% for new listings and 2.5% for sales when compared to the second quarter of 2013, respectively.
• Bank owned/REO properties comprised 6.3% of new listings and 8.4% of sales in the third quarter of 2013, down .6% and 2.3% from the second quarter of 2013, respectively.
If you’d like more information or percentages of distressed residential sales in other areas not represented by our charts, please contact us at communications@rmls.com.
![Residential Distressed Properties for First Quarter (January-March) 2014]()
by RMLS Communication Department | Aug 7, 2013

Click to enlarge
The RMLS™ Inventory Today chart on the desktop of RMLSweb showed that total sales volume for a twelve month period topped $12 billion on July 16th this year. The last time the sales volume was at that level was almost five years ago on September 8, 2008, with volume still on its way down to its low point reached in 2011.
While prices are currently increasing rapidly, they still have a way to go to reach their previous levels. The $12 billion volume in 2008 required only 39,456 sales at an average price of $304,443. The number of sales represented by the $12 billion this year was 46,901 with an average price of $255,942.
The housing market recovery has encompassed all of the RMLS™ market areas in Oregon and southern Washington to varying degrees, which the monthly Market Action reports demonstrate. Momentum is accelerating!
![Residential Distressed Properties for First Quarter (January-March) 2014]()
by RMLS Communication Department | Jul 18, 2013

This chart shows the number of bank owned/REO properties and short sales in all areas of the RMLS™ system during the second quarter of 2013.
Below are links to additional charts for some of our larger areas.
• Portland Metro Distressed Properties (2nd Quarter 2013)
• Clark County, WA Distressed Properties (2nd Quarter 2013)
• Lane County, OR Distressed Properties (2nd Quarter 2013)
• Douglas County, OR Distressed Properties (2nd Quarter 2013)
• Coos County, OR Distressed Properties (2nd Quarter 2013)
Here are some additional facts about distressed residential properties in the second quarter of 2013:
All areas when comparing percentage share of the market, second quarter 2013 to first quarter 2013:
• When comparing the second quarter 2013 to first quarter 2013, distressed sales as a percentage of new listings decreased by 6.3% (9.0% v. 15.3%).
• In a comparison of the second quarter 2013 to first quarter 2013, distressed sales as a percentage of closed sales decreased by 9.2% (15.3% v. 24.5%).
• Short sales comprised 5.7% of new listings and 8.5% of sales in the second quarter of 2013, down 3.5% and down 2.9% from the first quarter of 2013, respectively.
• Bank owned/REO properties comprised 3.3% of new listings and 6.8% of sales in the second quarter of 2013, down 2.8% and 6.3% from the first quarter of 2013, respectively.
Portland Metro when comparing percentage share of the market, second quarter 2013 to first quarter 2013:
• When comparing the second quarter 2013 to first quarter 2013, distressed sales as a percentage of new listings decreased by 5.8% (8.1% v. 13.9%).
• In a comparison of second quarter 2013 to first quarter 2013, distressed sales as a percentage of closed sales decreased by 8.8% (13.4% v. 22.2%).
• Short sales comprised 5.8% of new listings and 8.4% of sales in the second quarter of 2013, down 2.9% and 2.8% from the first quarter of 2013, respectively.
• Bank owned/REO properties comprised 2.3% of new listings and 5.0% of sales in the second quarter of 2013, down 2.9% and 6.0% from the first quarter of 2013, respectively.
Clark County when comparing percentage share of the market, second quarter 2013 to first quarter 2013:
• When comparing the second quarter 2013 to first quarter 2013, distressed sales as a percentage of new listings decreased by 7.1% (16.6% v. 23.7%).
• In a comparison of second quarter 2013 to first quarter 2013, distressed sales as a percentage of closed sales decreased by 6.3% (24.3% v. 30.6%).
• Short sales comprised 9.7% of new listings and 13.6% of sales in the second quarter of 2013, down 5.0% for new listings and 5.1% for sales when compared to the first quarter of 2013, respectively.
• Bank owned/REO properties comprised 6.9% of new listings and 10.7% of sales in the second quarter of 2013, down 2.1% and 1.2% from the first quarter of 2013, respectively.
If you’d like more information or percentages of distressed residential sales in other areas not represented by our charts, please contact us at communications@rmls.com.
![Residential Distressed Properties for First Quarter (January-March) 2014]()
by RMLS Communication Department | Apr 19, 2013
 This chart shows the number of bank owned/REO properties and short sales in all areas of the RMLS™ system during the first quarter of 2013.
Below are links to additional charts for some of our larger areas.
• Portland Metro Distressed Properties (1st Quarter 2013)
• Clark County, WA Distressed Properties (1st Quarter 2013)
• Lane County, OR Distressed Properties (1st Quarter 2013)
• Douglas County, OR Distressed Properties (1st Quarter 2013)
• Coos County, OR Distressed Properties (1st Quarter 2013)
Here are some additional facts about distressed residential properties in the first quarter of 2013:
All areas when comparing percentage share of the market, first quarter 2013 to fourth quarter 2012:
• When comparing the first quarter 2013 to fourth quarter 2012, distressed sales as a percentage of new listings decreased by 6.1% (15.3% v. 21.4%).
• In a comparison of the first quarter 2013 to fourth quarter 2012, distressed sales as a percentage of closed sales increased by 0.9% (24.5% v. 23.6%).
• Short sales comprised 9.2% of new listings and 11.4% of sales in the first quarter of 2013, down 2.1% and down 0.5% from the fourth quarter of 2012, respectively.
• Bank owned/REO properties comprised 6.1% of new listings and 13.1% of sales in the first quarter of 2013, down 4.0% and up 1.4% from the fourth quarter of 2012, respectively.
Portland Metro when comparing percentage share of the market, first quarter 2013 to fourth quarter 2012:
• When comparing the first quarter 2013 to fourth quarter 2012, distressed sales as a percentage of new listings decreased by 7.2% (13.9% v. 21.1%).
• In a comparison of first quarter 2013 to fourth quarter 2012, distressed sales as a percentage of closed sales decreased by 0.6% (22.2% v. 22.8%).
• Short sales comprised 8.7% of new listings and 11.2% of sales in the first quarter of 2013, down 3.3% and 1.1% from the fourth quarter of 2012, respectively.
• Bank owned/REO properties comprised 5.2% of new listings and 11.0% of sales in the first quarter of 2013, down 3.9% and up 0.5% from the fourth quarter of 2012, respectively.
Clark County when comparing percentage share of the market, first quarter 2013 to fourth quarter 2012:
• When comparing the first quarter 2013 to fourth quarter 2012, distressed sales as a percentage of new listings decreased by 3.0% (23.7% v. 26.7%).
• In a comparison of first quarter 2013 to fourth quarter 2012, distressed sales as a percentage of closed sales increased by 1.8% (30.6% v. 28.8%).
• Short sales comprised 14.7% of new listings and 18.7% of sales in the first quarter of 2013, down 3.1% for new listings and up 0.1% for sales when compared to the fourth quarter of 2012, respectively.
• Bank owned/REO properties comprised 9.0% of new listings and 11.9% of sales in the first quarter of 2013, up 0.1% and 1.7% from the fourth quarter of 2012, respectively.
If you’d like more information or percentages of distressed residential sales in other areas not represented by our charts, please contact us at communications@rmls.com.


