by RMLS Communication Department | Nov 20, 2009
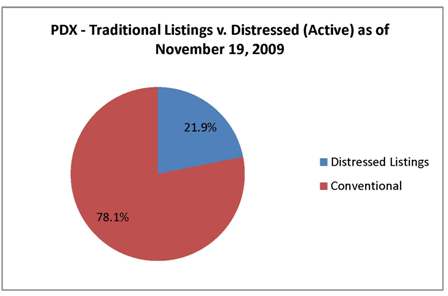
21.9% of listings distressed in PDX, 31.7% in Clark County
The latest report from the Mortgage Bankers Association indicated that the rate of foreclosure for people with fixed rate loans and good credit is on the rise.
The AP reports that homeowners’ inability to keep up with payments is now more due to unemployment, rather than the subprime loans that contributed to the initial increase in foreclosures.
A quick search on RMLSweb reveals that in the Portland Metro area, distressed properties currently make up 21.9% of active residential listings (this number takes into account listings that require third-party approval, as this typically indicates a short sale and those that are marked as bank-owned).

In Clark County, 31.7% of residential listings are distressed.

by RMLS Communication Department | Jul 31, 2009
With all the stories in the media, it seems like everyone is facing foreclosure these days. (Even Michael Jackson’s doctor.) So I thought it would be interesting to look at the foreclosure market in our service area to find out what’s really going on.
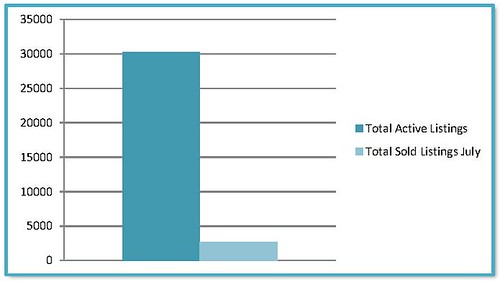
We currently have 30,276 active residential listings in RMLSweb–this includes Oregon and Washington. Of those, 1,172 are marked as Bank Owned. That’s approximately 3.9%.
Out of curiosity, I took my research a little further to find out how well Bank Owned properties are selling versus the entire inventory in our markets. So far in July 2009, 2,707 properties in our entire database sold. According to my research, 430 of them were marked Bank Owned.

If we didn’t add any more listings of any kind to RMLSweb and the active residential properties kept selling at the same rate they did in July it would take 11.2 months to sell our entire inventory and only 2.7 months to exhaust the inventory of Bank Owned Properties.

Granted, it’s only the morning of the last day of July so it’s likely that we’ll see the numbers of sales go up over the next few days, but this should give you a snapshot of what’s going on with Bank Owned properties.
by RMLS Communication Department | Jul 23, 2009
Lots of people are talking about short sales and foreclosures these days. If you didn’t know better, you might think that they’re the dominant type of listing for sale. But fortunately, you do know better and starting next week when we add two new short sale fields to RMLSweb (more on that later) it’s going to be even easier for you to keep tabs on these distressed properties.
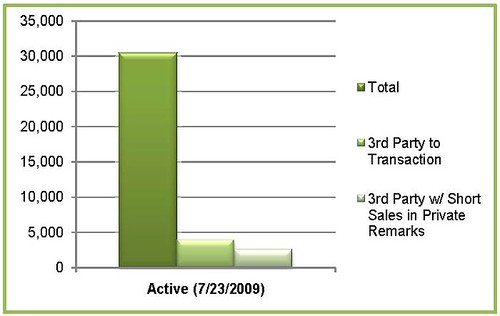
The graph below shows you the total number of active listings in RMLSweb as of today, July 23, 2009, compared with the number of active listings that are checked 3rd Party to Transaction Yes – approximately 12.8%.

(Since 3rd Party to Transaction doesn’t necessarily mean it’s a short sale – it could also be an estate sale or relo property, for example – I’ve also included the number of 3rd Party to Transaction that mention short sale in the Private Remarks.)
The next logical question is how well are these properties selling? To help answer that here’s another chart that shows the number of listings marked 3rd Party to Transaction Yes that are currently active , currently pending and that sold in the first half of the year.

As I mentioned earlier, 3rd Party to Transaction Yes does not necessarily mean a listing is a short sale. Therefore, to handle short sales more efficiently and to help the other types of properties that require 3rd Party approval to get fair attention, the RMLS™ Board of directors voted to add the following fields to RMLSweb:
Short Sale Yes/No – will be required when entering a listing and 3rd Party to Transaction will be automatically checked when Yes is selected.
Short Sale Offer (Seller Accepted; Submitted for Approval) Yes/No – The rules will be revised to require updating this field when an offer is made.
For more information on short sales see the National Association of Realtors Field Guide to Short Sales.
P.S. Be sure to check back for statistics on Bank Owned properties to come soon.
by RMLS Communication Department | Jun 18, 2009
One of the most interesting statistics I saw in the latest issues of Market Action was the increase of pending sales compared to May 2008 in Clark County. This was the second month in a row that the number of pending sales rivaled that of the same time period a year ago. This is good news! But what caught me by surprise was that the number of closed sales is still down from the same time a year ago.
So I started to wonder:
1) On average how long does it take for pending listings to show up as sold? According to the National Association of Realtors® pending home sales typically “become existing-home sales one-to-two months later.”
2) What percentage of accepted offers fail these days? Using a formula that I got from my new friend Chuck Reiling, a real estate professional in Seattle, WA, I took a stab at calculating the fallouts for properties in Clark County.
Following Chuck’s formula I looked at the pending listings monthly from May 1, 2007 to May 31, 2009 and the closed sales from June 1, 2007 to May 31, 2009. Like Chuck I staggered the pendings by one month to allow for a “typical” close time and I used a two month running average to adjust for variances.
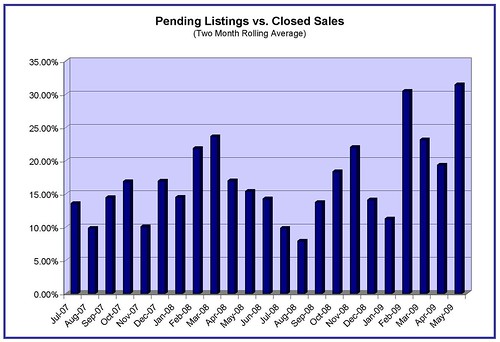
Here’s a graph of the ratios:

The average pending vs. closed sale ratio is 17 percent. You’ll notice that the last few months have all been above that rate, with May 2009 coming in at 31.4 percent (the highest so far).
According to Eric Newman, a Mortgage Banker with Summit Mortgage Corp, these numbers may not actually reflect sale fails, but rather sale delays. Newman says that these days there are a number of factors that increase closing time, from waiting on bank approval when needed (approximate average of three weeks) to overwhelmed underwriters (current response time for FHA loans is around 21 days).
For example, I did a quick search in RMLSweb and discovered that out of the 552 properties that went pending in Clark County in April, approximately 117 were marked as requiring 3rd party approval (not all of these listings are short sales, but most of them are) and 122 were listed as bank owned. That’s almost half of the pending listings – 43 percent.
While it’s likely that a percentage of these more complicated transactions do fail, it also may be that these listings take longer to close so the typical one month lag may not apply. Newman says we would expect that most of those pending listings will probably not be recorded as closed until June because many loans are taking 45 to 60 days to close in the current market.
What do you think? What are you seeing out in the field?