by Christina Smestad | Jan 9, 2020
Here we go again! RMLS™ celebrates another year working hard for thousands of subscribers across Oregon and Southwest Washington by presenting an annual collection of numbers. These numbers show just how much RMLS™ has supported real estate activity over the course of 2019. We hope you enjoyed journeying along with us.
Compare the numbers below with the same from prior years and see how we’ve grown!
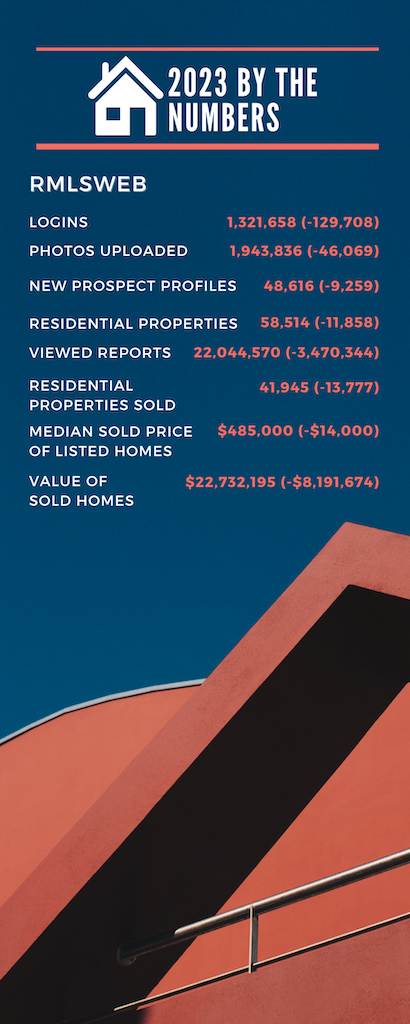
RMLSweb
Number of times subscribers logged in to RMLSweb: 1,723,212
Photos uploaded to listings: 2,033,235
Number of new prospect profiles created: 66,667
All residential properties listed for sale: 77,296
All residential properties sold: 57,475
Median sold price of homes listed: $365,000
Total dollar volume of homes sold: $23,224,875,000
Reports viewed: 8,148,542
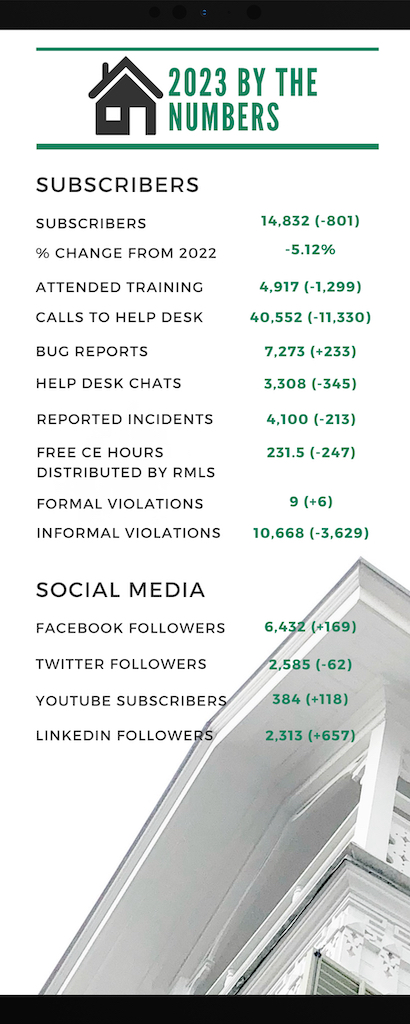
RMLS™ Subscribers
RMLS™ subscribers as of December 2019: 14,524
New RMLS™ subscribers (compared to December 2018): 35
Increase in subscribers, above: +0.24
Subscribers who attended training: 3,331
Number of calls to the RMLS™ Help Desk: 24,382
Number of Help Desk chats: 5,595
Number of incidents reported using the “Report Issue” button: 5,715
CE hours distributed by RMLS™ at no cost to subscribers: 1,742
Total attendance at RMLS™ training events: 3,652
Social Media
RMLS™ followers on Facebook (December 31st): 4,361
RMLS™ followers on Twitter (December 31st): 2,940
RMLS™ regularly compiles plenty of other numbers as well! In addition to publishing Market Action each month, we have statistical summaries available on RMLSweb with information dating back several years.
We love numbers here at RMLS™, and hope you find this data as fun and interesting as we do.
by Christina Smestad | Jan 11, 2019
Here we go again! RMLS™ celebrates another year working hard for thousands of subscribers across Oregon and Southwest Washington by presenting an annual collection of numbers. These numbers show just how much RMLS™ has supported real estate activity over the course of 2018. We hope you enjoyed journeying along with us.
Compare the numbers below with the same from prior years and see how we’ve grown!
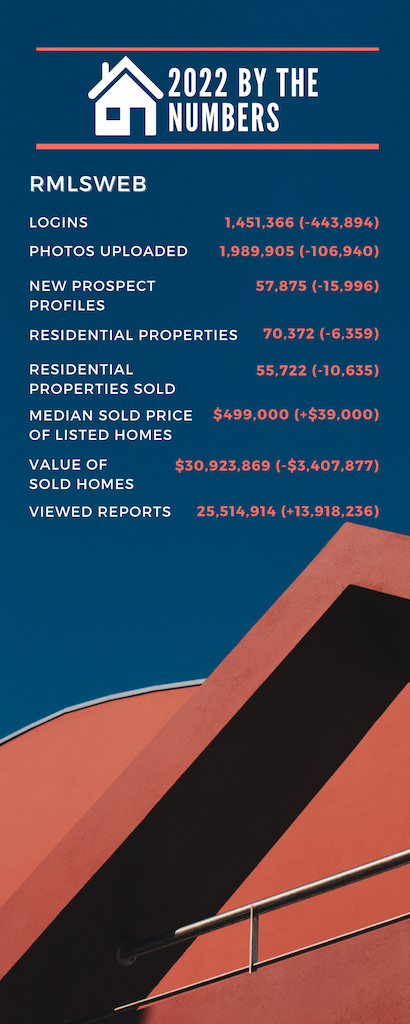
RMLSweb
Number of times subscribers logged in to RMLSweb: 1,662,042
Photos uploaded to listings: 1,981,602
Number of new prospect profiles created: 71,914
All residential properties listed for sale: 78,378
All residential properties sold: 57,902
Median sold price of homes listed: $350,000
Total dollar volume of homes sold: $22,455,096,000
Reports viewed: 8,286,339
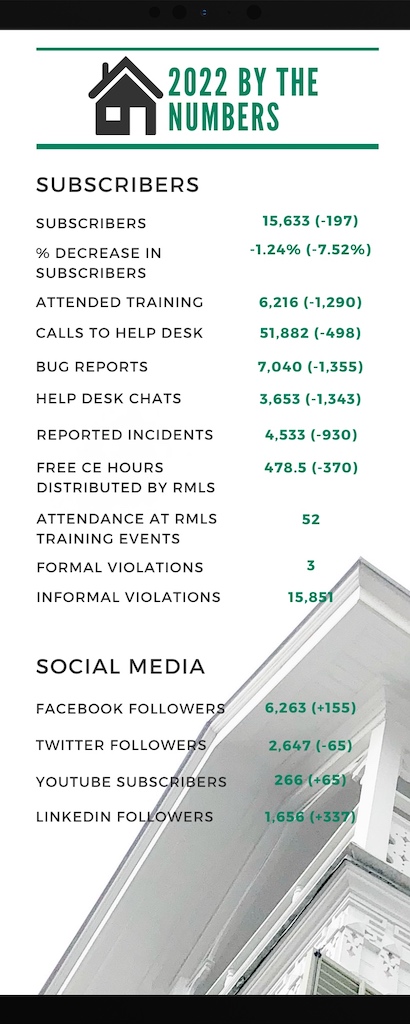
RMLS™ Subscribers
RMLS™ subscribers as of December 2018: 14,489
New RMLS™ subscribers (compared to December 2017): 516
Increase in subscribers, above: +3.69
Subscribers who attended training: 5,406
Number of calls to the RMLS™ Help Desk: 27,794
Number of Help Desk chats: 5,215
Number of incidents reported using the “Report Issue” button: 7,027
CE hours distributed by RMLS™ at no cost to subscribers: 1,565
Total attendance at RMLS™ training events: 5,747
RMLS.com
Total customer visits to RMLS.com: 2,120,150
Unique visits: 791,455
Total listing views: 1,145,379
Social Media
RMLS™ followers on Facebook (December 31st): 4,289
RMLS™ followers on Twitter (December 31st): 2,937
RMLS™ regularly compiles plenty of other numbers as well! In addition to publishing Market Action each month, we have statistical summaries available on RMLSweb with information dating back several years.
We love numbers here at RMLS™, and hope you find this data as fun and interesting as we do.


